Sunlight Doubles Aboveground Carbon Loss in a Seasonally Dry Woodland in Patagonia
Summary
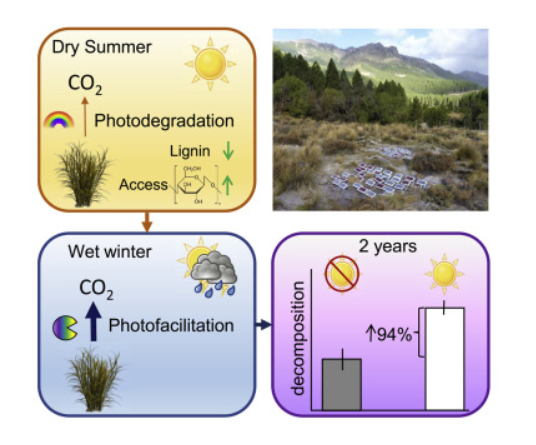
Photodegradation of aboveground senescent plant material (plant litter) due to exposure to solar radiation has been identified as a dominant control on carbon (C) loss in semi-arid ecosystems, upturning traditional models of C cycling based only on available moisture and litter quality. In addition to the photochemical mineralization of organic matter, sunlight alters the chemistry of cell walls in plant litter, making them more susceptible to subsequent biotic degradation. Nevertheless, the interactive effects of sunlight exposure, climate seasonality, and biotic decomposition on C turnover remain unresolved in terrestrial ecosystems. We show here that exposure to sunlight accelerated litter decomposition in a Patagonian woodland with a marked dry summer season. Controls on initial decomposition varied seasonally from direct photochemical mineralization in the dry summer to biotic degradation in the wet winter. By manipulating sunlight received by plant litter using spectral filters that attenuated ultraviolet and short-wave visible light, we demonstrate that direct photodegradation and its legacy, associated with increased microbial access to labile carbohydrates, are responsible for the acceleration of aboveground C turnover in this Mediterranean-type climate. Across plant species and over a 2-year period, litter exposed to the full solar spectrum decomposed twice as fast as litter that received attenuated sunlight. Changes in vegetation cover or biodiversity due to projected increased drought and dry season length will likely exacerbate C losses from aboveground litter due to sunlight exposure, negatively impacting the C balance in ecosystems that are particularly vulnerable to global change.
Keywords: solar radiation; carbon cycle; litter decomposition; photodegradation; Mediterranean-type; climate; drylands; semi-arid ecosystems; global change; Patagonia; Argentina
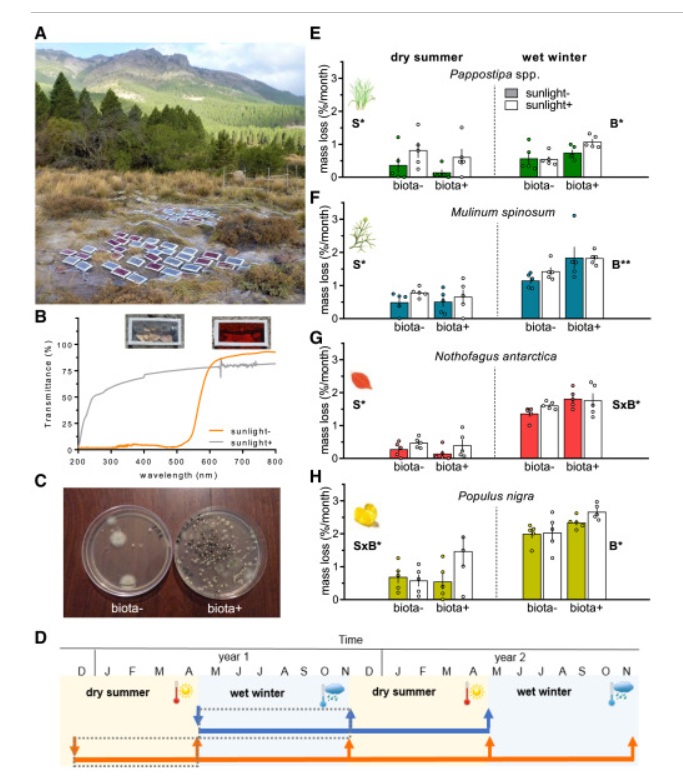
Figure 1. The Controls on Initial Leaf Litter Decomposition Vary Seasonally in a Patagonia Woodland Ecosystem, between Sunlight in the Dry Summer and Biota in the Wet Winter
(A) Field site in Villa Meliquina, Argentina. The litter decomposition experiment is in the foreground where solar radiation attenuation and soil/litter biota were manipulated; this design was used to disentangle the relative contributions of photodegradation and biotic decomposition over 2 years in this semi-arid woodland with a Mediterranean-type climate (Figure S1).
(B) Close-up of litterboxes and transmittance of plastic filters used to generate two solar radiation levels: attenuated solar radiation (which effectively blocks all wavelengths that cause photodegradation; filter cutoff λ ≃ 550 nm, Rosco E-Color 135 Deep Golden Amber [3], orange line, sunlight–) and full solar radiation (λ > 290 nm, Agropol agroethylene, gray line, sunlight+).
(C) Bacterial and fungal colony-forming units (CFUs) on litter in control plots (with soil biota, biota+) and with biocide application and gamma-sterilized litter (biota–) (data in Figure S2).
(D) Schematic showing the timing and harvests of litter decomposition experiments. For a complete description, see Figure S1E. Recently senesced litter was added at the beginning of the dry summer (December, orange down arrow) and then again immediately before the beginning of the wet winter (May, blue down arrow) season. Litterboxes were harvested at the end of each season (up arrows).
(E–H) Leaf litter-mass loss (% per month) under sunlight and soil biota treatments during the dry summer season (left) and the wet winter season (right). Pappostipa spp. (green, D), Mulinum spinosum (blue, E), Nothofagus antarctica (red, F), and Populus nigra (yellow, G). Data correspond to the first harvest of the experiment that started in the dry summer season (December 2014) and the one that started in the wet winter season (May 2015). Shaded bars indicate attenuated solar radiation; open bars indicate full solar radiation treatment. Mean, standard error, and individual data points are shown (n = 5).
∗p < 0.05, ∗∗p < 0.01 for sunlight (S), biota (B), and their interaction (SxB). Data for (E)–(H) are shown with the gray dashed lines outlined in the schematic timeline (D). See also Tables S1 and S3.
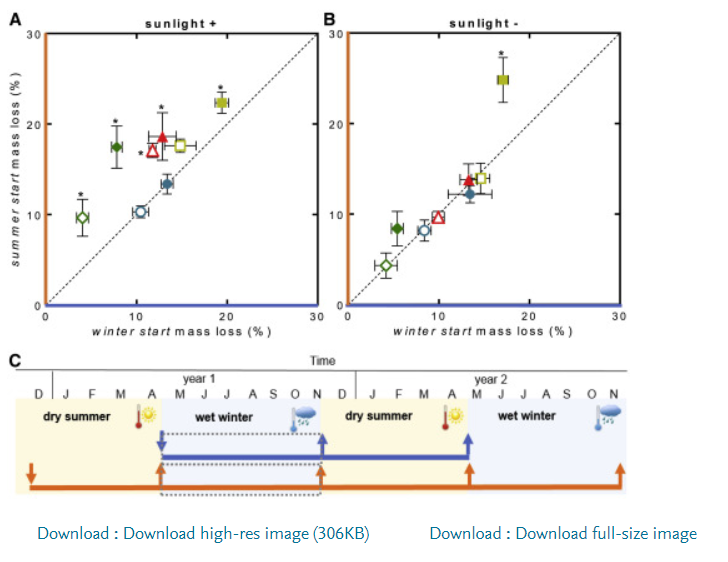
Figure 2. Exposure to Solar Radiation during the Dry Summer Season Accelerates Leaf Litter Decomposition in the following Wet Winter Season
Litter-mass loss (%) during the wet winter season in a semi-arid woodland in Patagonia, Argentina, when litter was incubated in the field during the previous dry summer season (summer start, y axis) and when litter was placed in the field immediately at the beginning of the wet winter season (winter start, x axis). Litter-mass loss in the dry season is not shown. Open symbols indicate treatments with biocide addition to partially reduce soil biota (biota–); shaded symbols indicate control plots for biocide treatments (biota+).
(A) Organic mass loss (%) of the four litter species under full solar radiation (sunlight+) treatments.
(B) Organic mass loss (%) of the four litter species under attenuated solar radiation (sunlight–) treatments. Dashed lines in the (A) and (B) show the 1:1 relationship between litter-mass loss for the summer start and winter start litter. Symbols above this dashed line indicate accelerated decomposition during the wet winter for the summer start litter. Symbols are means with standard error (n = 5) of each litter species. Symbol colors and shapes indicate litter species: Pappostipa spp. (green diamond), M. spinosum (blue circles), N. antarctica (red triangles), and P. nigra (yellow squares). Asterisks indicate significant differences (p < 0.05) between the summer start and winter start litter organicmass loss.
(C) Schematic showing timing and harvests of litter decomposition experiments (for more details, see Figures 1 and S1). Gray dashed boxes outlined in the schematic timeline show the time points of the experiments for the data in this figure.
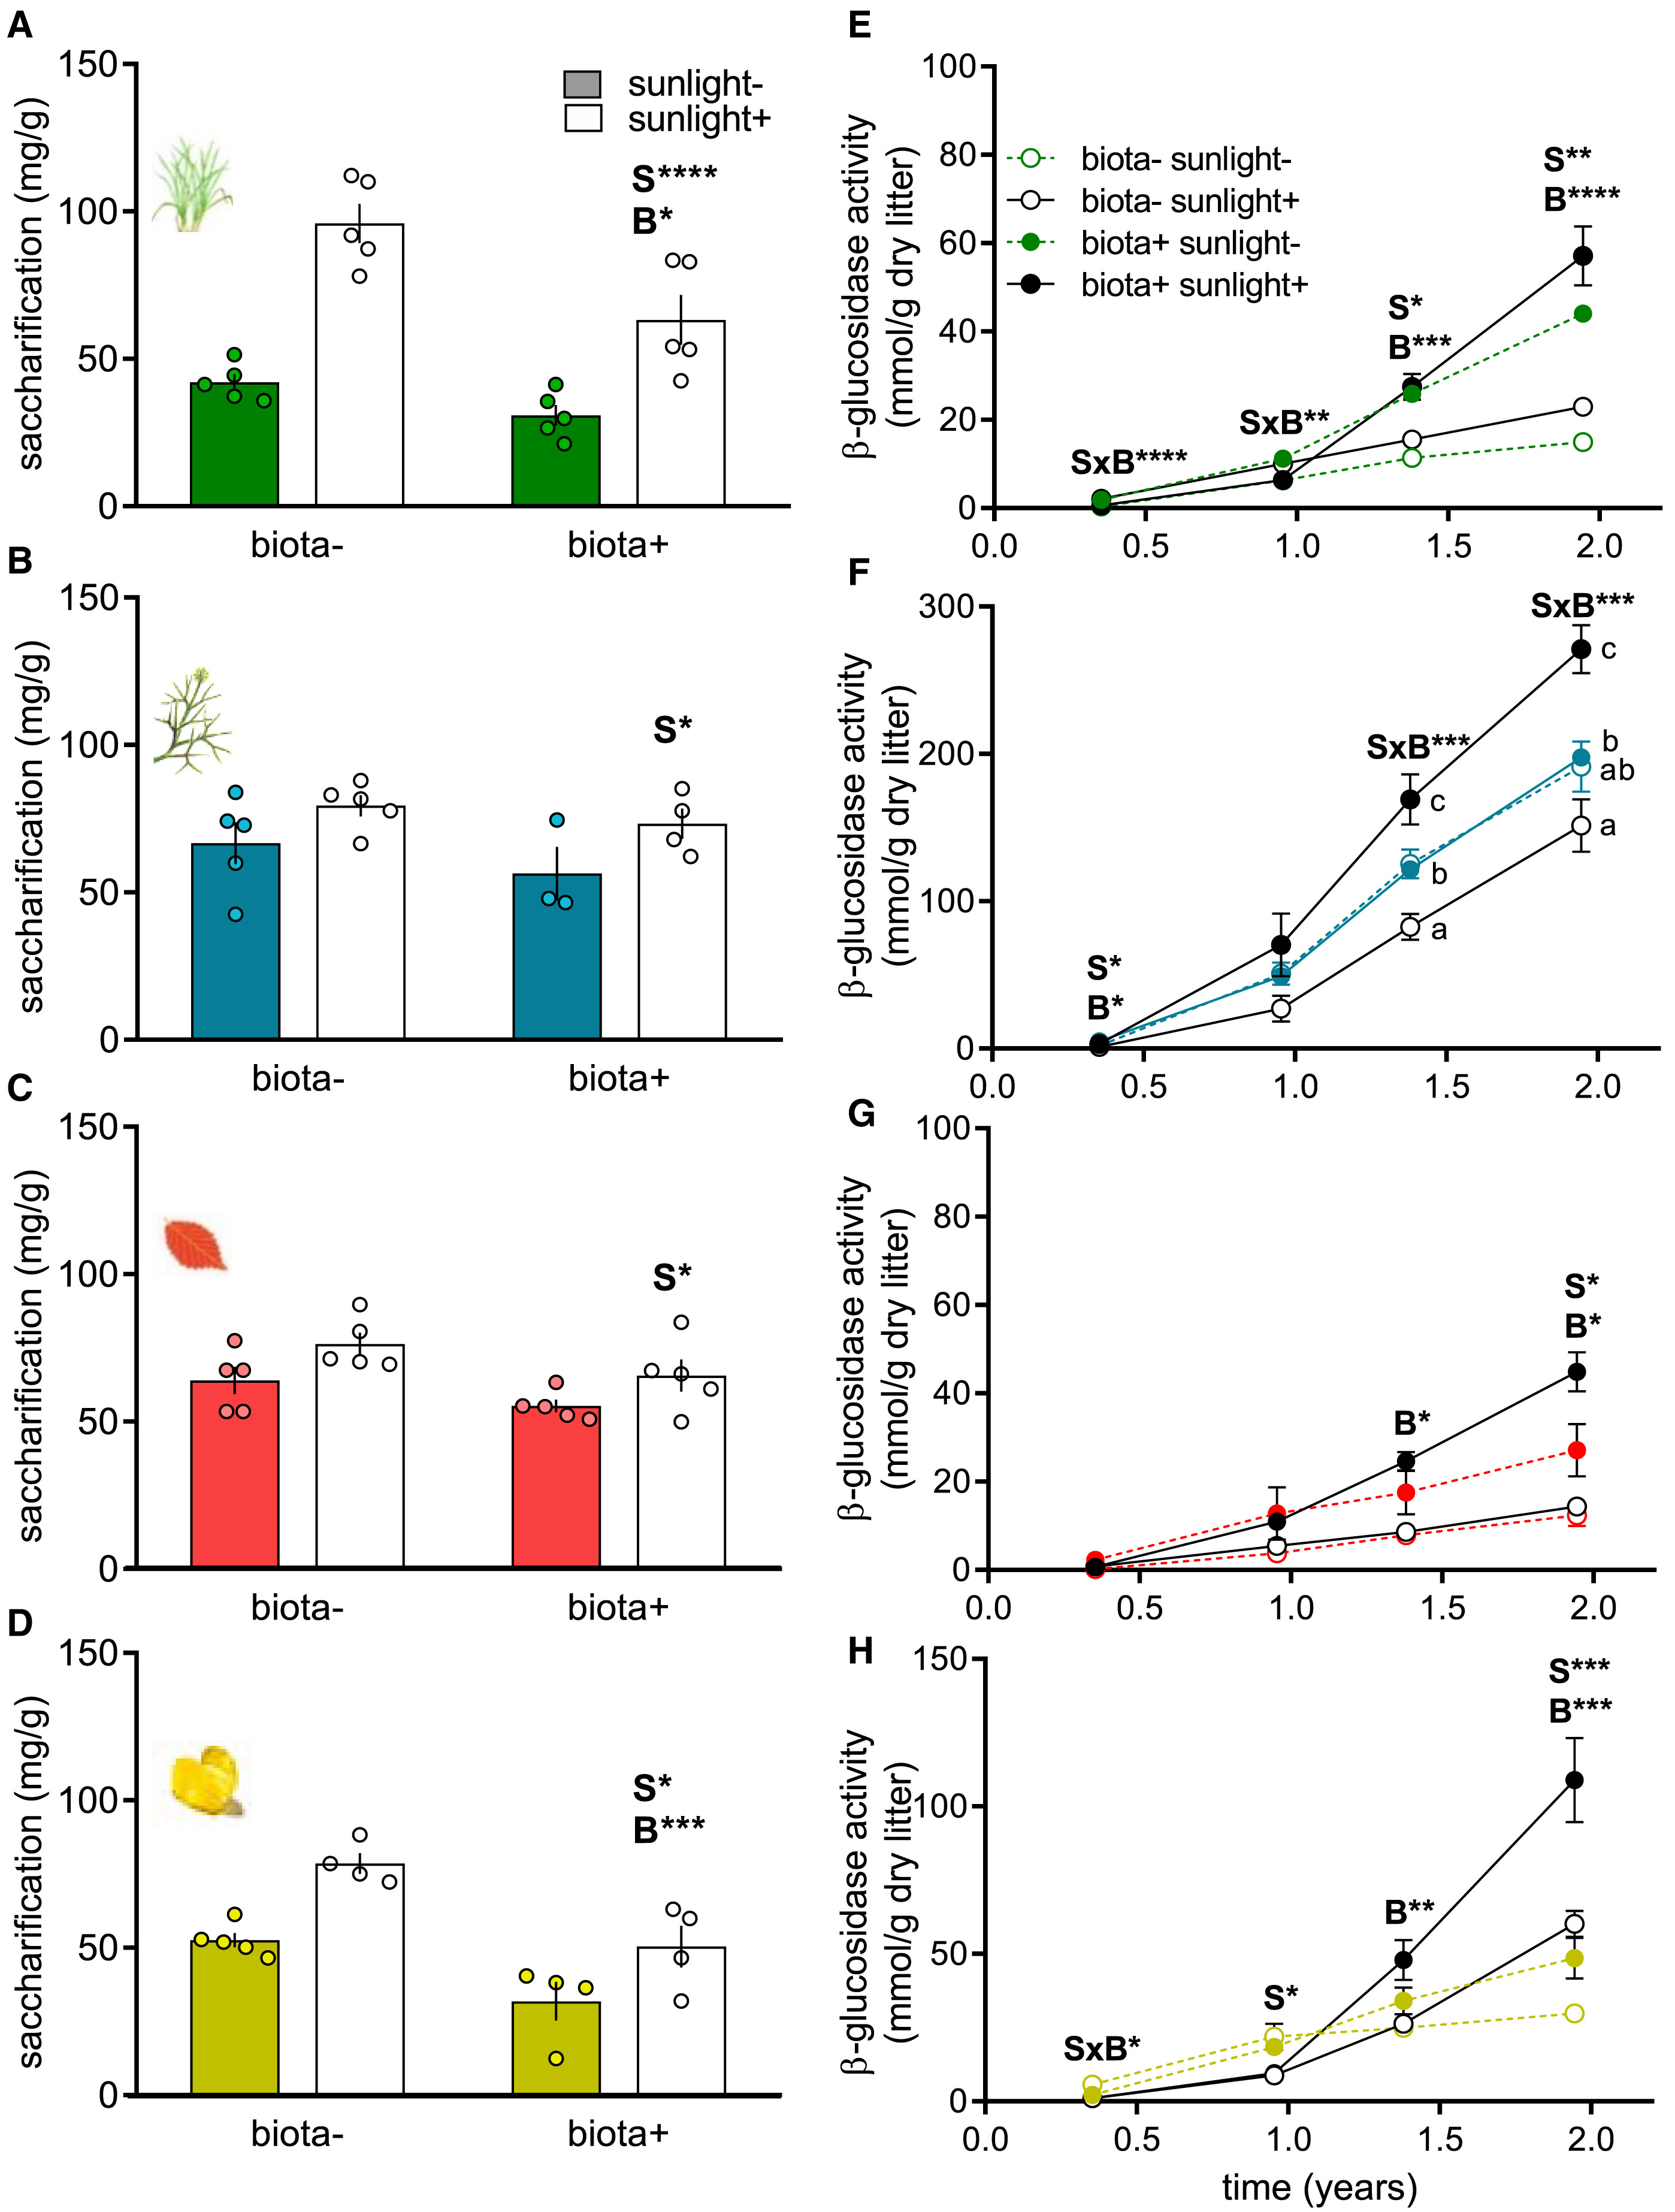
Figure 3. Exposure to Full Solar Radiation Consistently Increases Access to Litter Polysaccharides for Microbial Enzymes and Stimulates Microbial Enzymatic Activity in Litter
(A–D) Litter saccharification (the amount of monosaccharides produced by a saturating dose of microbial cellulase; see STAR Methods for details) when litter substrate had been incubated for 1 year starting in dry summer under each of the four combinations of sunlight and biota. Each panel shows a different litter species: (A) Pappostipa spp., (B) M. spinosum, (C) N. antarctica, and (D) P. nigra.
(E–H)) Accumulated potential β-glucosidase activity (a microbial enzyme associated with the last step of cellulose degradation) in litter during 2 years of incubation in the field. Shaded symbols indicate control plots (biota+), open symbols indicate treatments with biocide addition to reduce the soil biota (biota–), solid lines indicate full solar radiation treatment (sunlight+), dotted lines indicate attenuated solar radiation treatment (sunlight–).
Note that y axis scale differs among species. Symbol colors (from Figure 1) indicate leaf litter species: Pappostipa spp. (green, E), M. spinosum (blue, F), N. antarctica (red, G), and P. nigra (yellow, H). Means, standard errors, and individual data points (for saccharification only) are shown (n = 3–5). ∗p < 0.05, ∗∗p < 0.01, ∗∗∗p < 0.001, ∗∗∗∗p < 0.0001 for sunlight (S), biota (B), and their interaction (SxB). Different letters indicate significant differences among treatments (p < 0.05). See also Tables S2 and S4.
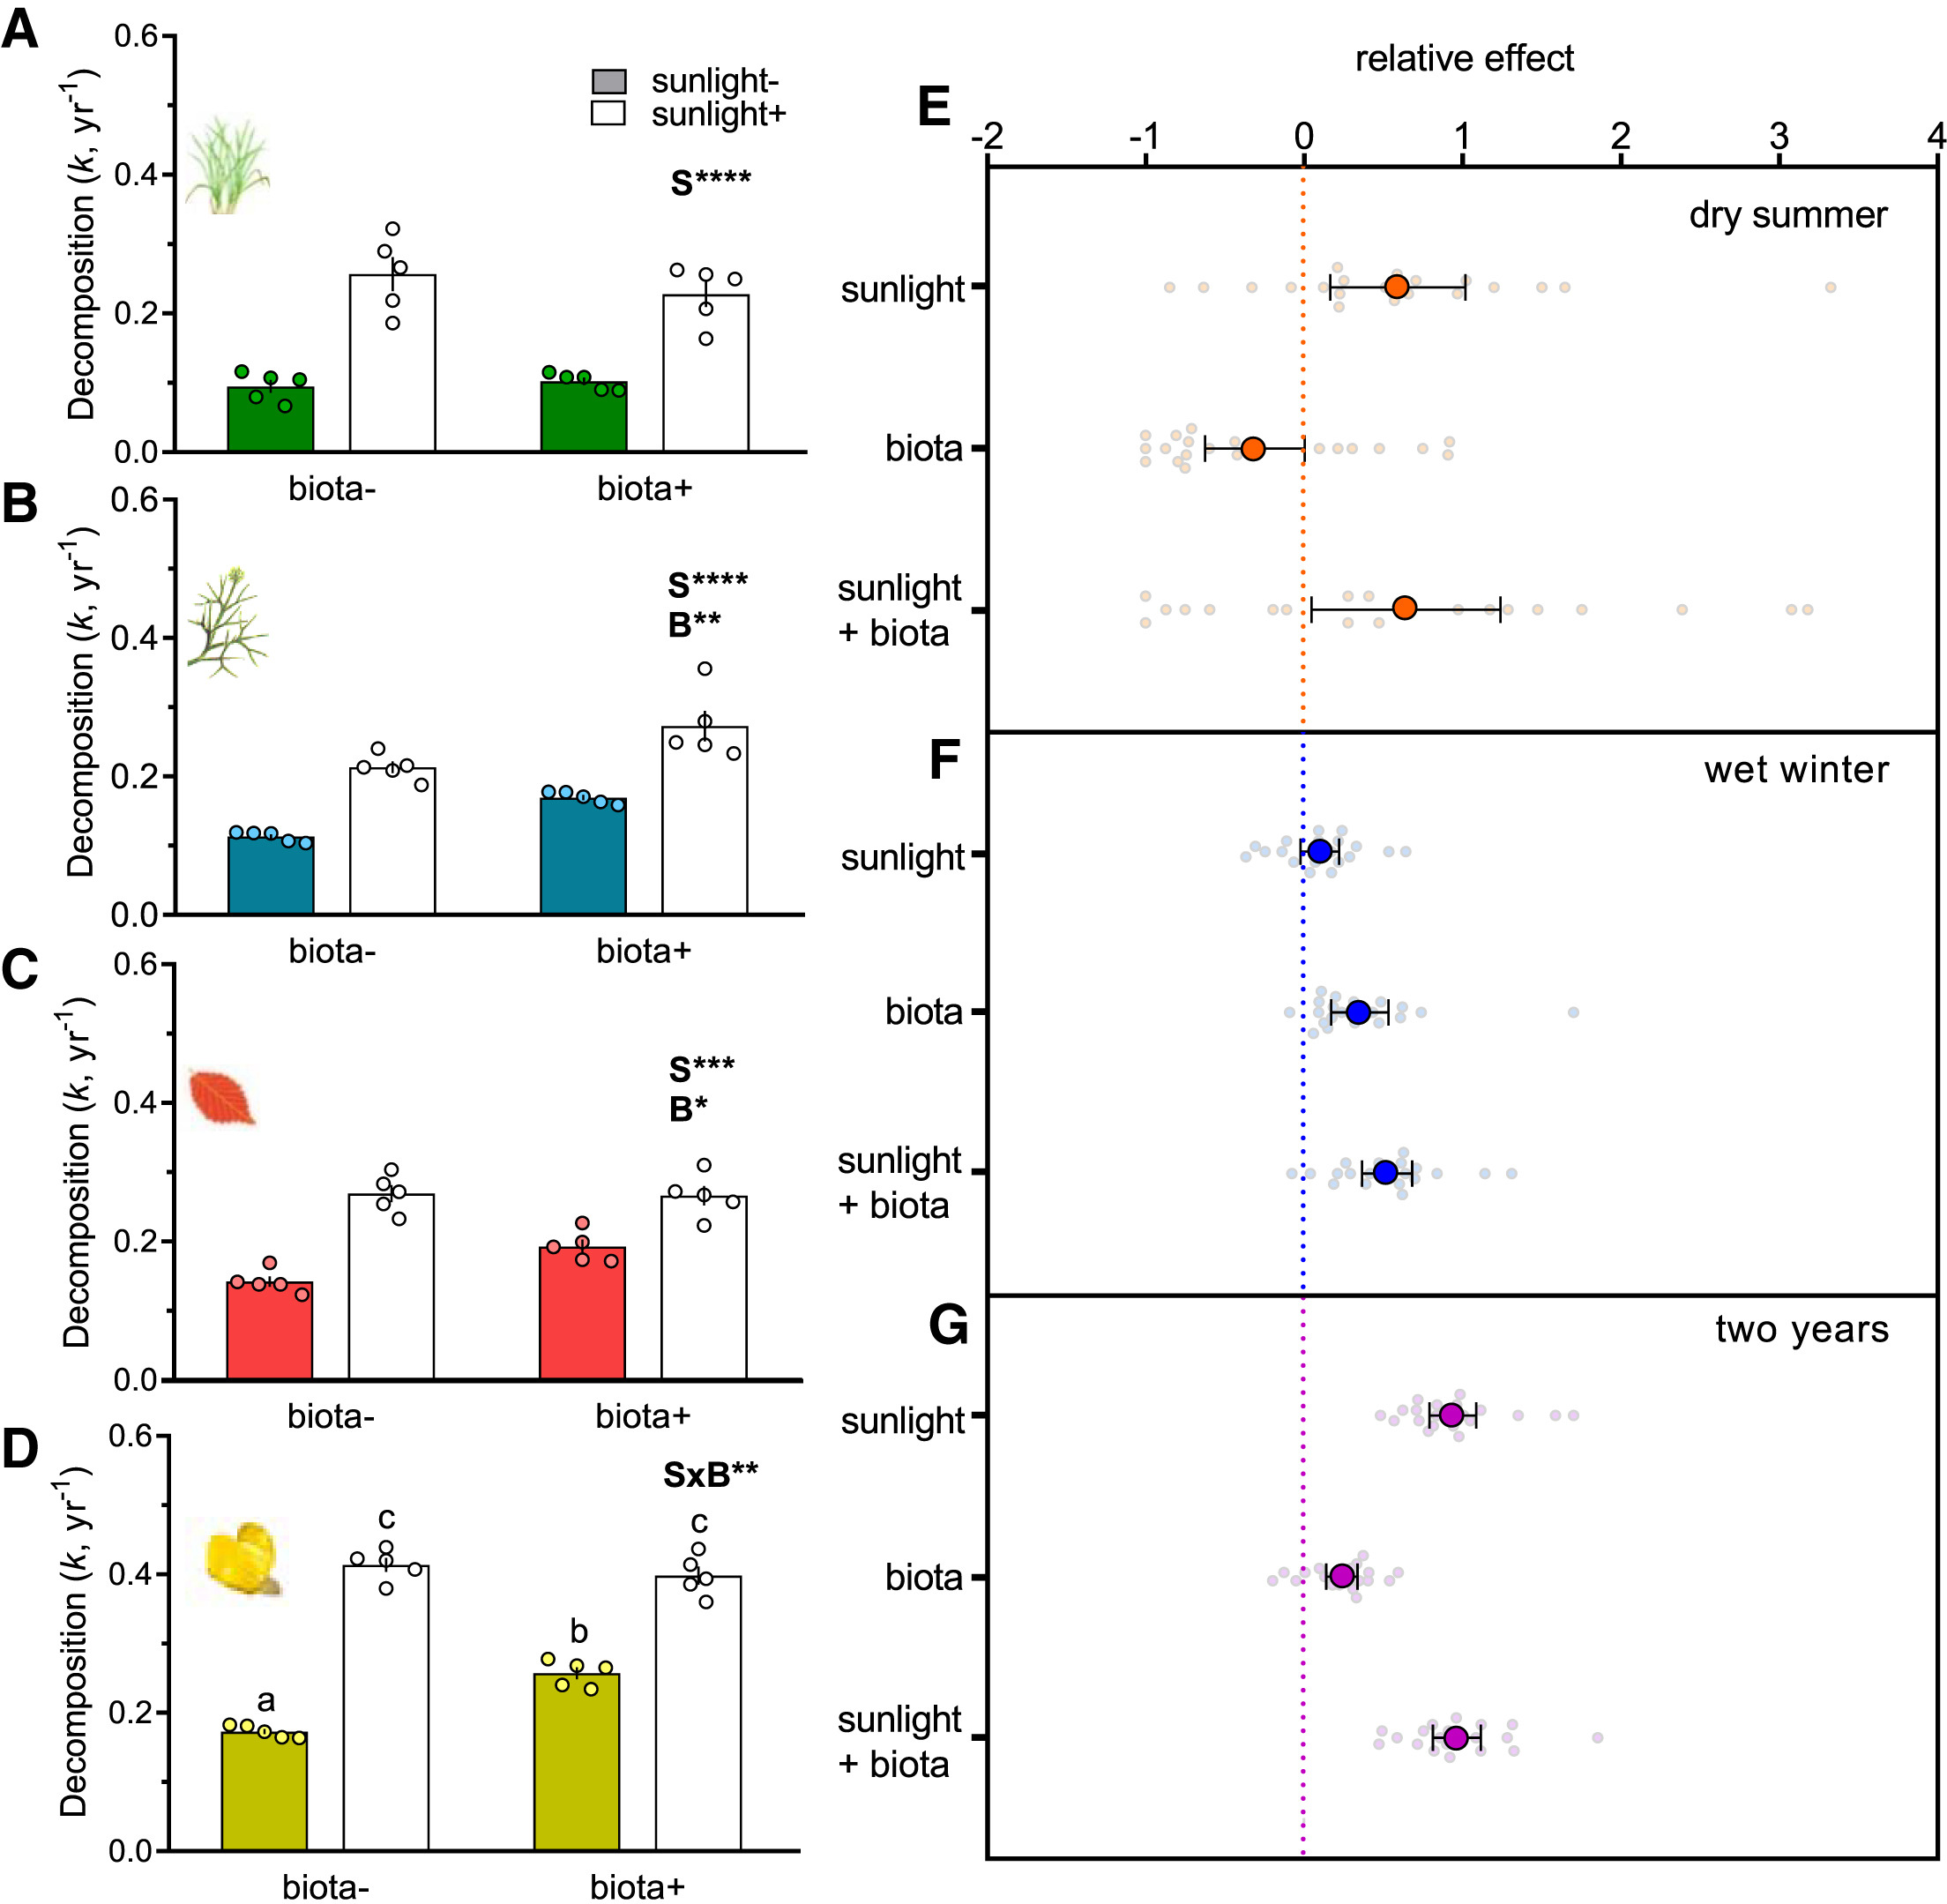
Figure 4. Sunlight Dominates over Soil/Litter Biota as the Principal Control on Leaf Litter Decomposition in a Semi-arid Woodland with Mediterranean-type Climate
(A–D) Decomposition constants (k) over the two-year incubation under attenuated (sunlight–) and full (sunlight+) solar radiation with treatments of reduced (biota–) and total (biota+) biota. Bars represent mean values, standard errors are small thin lines, and open small circles indicate individual data points (n = 5). Symbol colors (from Figure 1) indicate leaf litter species: Pappostipa spp. (green, A), Mulinum spinosum (blue, B), Nothofagus antarctica (red, C), and Populus nigra (yellow, D). Asterisks indicate significant differences at ∗p < 0.05, ∗∗p < 0.01, ∗∗∗p < 0.001, ∗∗∗∗p < 0.0001 for sunlight (S), biota (B) and their interaction (SxB). Different letters indicate significant differences among treatments (p < 0.05).
(E–G) Relative effect of sunlight, biota, and sunlight andbiota on mass loss during the first dry summer (orange, E) and wet winter (blue, F) season and after 2 years of incubation in the field (purple, G). The relative effect was calculated as [(mass losstreatment – mass losscontrol)/mass losscontrol], where treatments are sunlight (biota–, sunlight+), biota (biota+, sunlight–), sunlight and biota (biota+, sunlight+), and control (biota–, sunlight–). Means (larger colored symbols) with 95% confident intervals are shown (n = 20). Small gray symbols respresent individual data points of all replicates of four litter species. See also Figures S3 and S4.