The shedding and decay of eDNA in aquatic systems
Article 1:
Title: Quantification of Environmental DNA (eDNA) Shedding and Decay Rates for Three Marine Fish
Download website: https://doi.org/10.1021/acs.est.6b03114
Abstract :
Analysis of environmental DNA (eDNA) to identify macroorganisms and biodiversity has the potential to significantly augment spatial and temporal biological monitoring in aquatic ecosystems. Current monitoring methods relying on the physical identification of organisms can be time consuming, expensive, and invasive. Measuring eDNA shed from organisms provides detailed information on the presence and abundance of communities of organisms. However, little is known about eDNA shedding and decay in aquatic environments. In the present study, we designed novel Taqman qPCR assays for three ecologically and economically important marine fish—Engraulis mordax (Northern Anchovy), Sardinops sagax (Pacific Sardine), and Scomber japonicas (Pacific Chub Mackerel). We subsequently measured fish eDNA shedding and decay rates in seawater mesocosms. eDNA shedding rates ranged from 165 to 3368 pg of DNA per hour per gram of biomass. First-order decay rate constants ranged from 0.055 to 0.101 per hour. We also examined the size fractionation of eDNA and concluded eDNA is both intra- and extracellular. Finally, we derived a simple mass-balance model to estimate fish abundance from eDNA concentration. The mesocosm-derived shedding and decay rates inform the interpretation of eDNA concentrations measured in environmental samples and future use of eDNA as a monitoring tool.
Main content:
Figure 1. Conceptual model of the sources, transport, and fate of eDNA in aquatic environments. Processes illustrated here include eDNA shedding, decay (due to sunlight, grazing, or enzymatic activity), settling (of eDNA attached to particles), and advection and dispersion.
Figure 2. eDNA concentration in seawater mesocosm experiments: anchovies (A), sardines (B), mackerel (C), and mackerel plus sardine (D). y axis is the concentration of DNA determined with genomic DNA standards. Bottom x axis is time since the start of the experiment in hours, and top x axis is equivalent in units of days. Biological duplicates for each time point are represented as separate symbols. Error bars represent the standard deviation of triplicate qPCR measurements. Vertical lines represent when the fish were moved into the tank (first vertical line) and out of the tank (second vertical line).
Figure 3. Anchovy abundance in water volume at t = 0 as a function of anchovy eDNA age and mixing parameter α for a water sample containing 0.02 fg of anchovy DNA/mL of seawater. White portion of the graph gives unrealistically high fish counts meaning that it is unlikely to find 0.02 fg/mL after a specific time given a high degree of mixing. Black contours show lines of constant fish numbers.
Results:
After transferring the fish into the experimental tank, the concentration of eDNA increased over the first ∼12−24 h (Figure 2) until it reached a steady state concentration that did not change with time. This increase over the first day might be caused by elevated eDNA shedding rates due to the stress of being handled as observed in a previous study investigating the relationship between common carp biomass and eDNA in freshwater mesocosms. We observed that anchovies and sardines shed scales which sunk to the bottom of the tank. In contrast, the mackerel did not visibly shed scales but produced a visible mucus-like substance that appeared as a film on the water surface. Research is needed to determine the concentration of eDNA in different sources (e.g., tissue, scales, mucus, feces) as well as the effect of different fish physiologies, metabolic rates, and feeding on eDNA shedding. After 17−25 h, depending on the experiment, the eDNA concentration remained relatively constant for approximately 2 days (between approximately 20 and 70 h after the fish were added to the tank) at which point the fish were removed from the tank (Figure 2). At steady state, shedding balanced decay, and thus data from this period was used to calculate the DNA shedding rates. Our results also suggest that eDNA shedding rates on a per gram basis for mackerel and sardines are not affected by the presence of the other fish species. The shedding rate (pg/h/g) of 15 mackerel in the mackerel plus sardine experiment is similar to the shedding rate (pg/h/g) of the 20 mackerel in the mackerel-only experiment. Similarly, the shedding rate on a per gram basis of 30 sardines in the mackerel plus sardine experiment is similar to the shedding rate on a per gram basis of the 27 sardines in the sardine-only experiment. Additional research on whether the number of fish in a school influences the concentration of eDNA shed into the environment would be useful.
The similarity in k values across fish species suggests consistent eDNA decay mechanisms despite potentially different eDNA sources (e.g., fecal waste, scales, mucus). Decay rate constants also did not significantly change when two fish species were in the same tank, suggesting that decay rates are not strongly influenced by the presence of other fish or their eDNA in water.
Conclusion:
生物脱落的eDNA的数量与其质量有关,并且在物种之间有所不同。细胞内与细胞外eDNA均是生物eDNA浓度测量的重要贡献者。可根据eDNA的浓度来估算海水中鱼的丰度。
Article 2:
Title: Effects of Temperature and Trophic State on Degradation of Environmental DNA in Lake Water
Download website : https://doi.org/10.1021/acs.est.5b05672
Abstract:
Degradation of environmental DNA (eDNA) in aquatic habitats can affect the interpretation of eDNA data and the ability to detect aquatic organisms. The effect of temperature and trophic state on the decay of Common Carp (Cyprinus carpio) eDNA was evaluated using lake water microcosms and quantitative PCR for a Common Carp-specific genetic marker in two experiments. The first experiment tested the effect of temperature on Common Carp eDNA decay. Common Carp eDNA exhibited exponential decay that increased with temperature. The slowest decay rate was observed at 5 °C, with a T90 value (time to 90% reduction from initial concentration) of 6.6 days, as opposed to ∼1 day at higher temperatures. In a second experiment, decay was compared across waters from lakes of different trophic states. In this experiment, Common Carp eDNA exhibited biphasic exponential decay, characterized by rapid decay for 3−8 days followed by slow decay. Decay rate was slowest in dystrophic water and fastest in oligotrophic water, and decay rate was negatively correlated to dissolved organic carbon concentration. The overall rapid decay of eDNA and the effects of temperature and water quality should be considered in protocols for water sample storage and field sampling design.
Main content:
Fig. 1. Decay curves for the temperature experiment (A−D) and trophic state experiment (E−H). Decay curves are shown for eutrophic lake water at 5 °C (A), 15 °C (B), 25 °C (C), and 35 °C (D) and for well water (E), dystrophic lake water (F), eutrophic lake water (G), and oligotrophic lake water (H) at 15 °C. Error bars show 95% confidence intervals of the mean, and the solid line shows the fitted decay curve. Dotted lines show the T90 (time to 90% decay; left dotted line) and T99 (time to 99% decay; right dotted line) time points, and the dashed line shows the limit of detection (LOD). Time points with concentrations below the LOD are not shown.
Table 1. Characteristics of Decay Curves for the Temperature Experiment
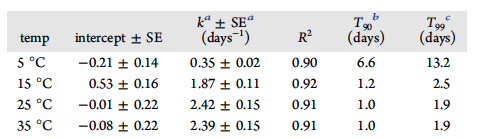
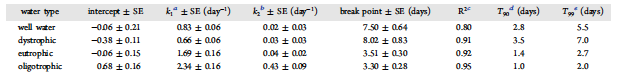
Table 2. Characteristics of Decay Curves for the Trophic State Experiment
Results:
Temperature affected the persistence time and decay rate of Carp eDNA in eutrophic lake water. Carp eDNA was below detection in lake water prior to its addition. The concentration of eDNA was 2.42✖️105 copies/mL at the start of the experiment, and it remained above the LOD (6 copies/mL) for 21 days at 5 °C and for 3 days at 15, 25, and 35 °C. Carp eDNA exhibited good fit to a one phase exponential decay model for all temperatures (Figure 1, Table 1), confirmed by an even and symmetrical distribution of residual plots. Decay was slowest at 5 °C (p < 0.05) relative to all other temperatures, with a T90 value of 6.6 days. T90 values at or above 15 °C were approximately 1 day. At greater temperatures, the only significant difference (p = 0.04) in the decay rate was observed between 15 and 25 °C, although the difference between 15 and 35 °C was significant at α = 0.1.
Trophic state affected the persistence of Carp eDNA. Carp eDNA was detectable until 10 days for oligotrophic lake water and until 28 days for dystrophic lake water, eutrophic lake water, and well water. Carp eDNA was absent from the test waters prior to its addition. After addition of Carp eDNA, the concentration of eDNA ranged less than an order of magnitude among water types, from 4.89✖️105 to 1.73✖️106 copies/mL . Decay of Carp eDNA was biphasic, with a period of rapid exponential decay followed by a period of slower decay (Figure 1). Trophic state significantly affected the initial decay rate (k1). The eDNA decay rates of well water and dystrophic lake water were not different (p = 0.08); however, the decay rates among lakes were (p < 0.01). The T90 values of well water and dystrophic lake water were approximately 3 d, as opposed to eutrophic and oligotrophic lake waters, with T90 values of 1.4 and 1.0 days, respectively. As we hypothesized, Carp eDNA decayed more slowly in well water than in oligotrophic and eutrophic lake water.
Conclusion:
温度及水体营养状态影响湖水中鲤鱼eDNA的持续时间和衰变速率,腐殖质的存在最有可能减慢鲤鱼eDNA的降解。
Yueting Pan