Article 1:
Title:Environmental Conditions Influence eDNA Persistence in AquaticSystems
Download website:https://pubs.acs.org/doi/pdf/10.1021/es404734p
Abstract : Environmental DNA (eDNA) surveillance holds great promise for improving species conservation and management. However, few studies have investigated eDNA dynamics under natural conditions, and interpretations of eDNA surveillance results are clouded by uncertainties about eDNA degradation. We conducted a literature review to assess current understanding of eDNA degradation in aquatic systems and an experiment exploring how environmental conditions can influence eDNA degradation. Previous studies have reported macrobial eDNA persistence ranging from less than 1 day to over 2 weeks, with no attempts to quantify factors affecting degradation. Using a SYBR Green quantitative PCR assay to observe Common Carp (Cyprinus carpio) eDNA degradation in laboratory mesocosms, our rate of Common Carp eDNA detection decreased over time. Common Carp eDNA concentration followed a pattern of exponential decay, and observed decay rates exceeded previously published values for aquatic macrobial eDNA. Contrary to our expectations, eDNA degradation rate declined as biochemical oxygen demand, chlorophyll, and total eDNA (i.e., from any organism) concentration increased. Our results help explain the widely divergent, previously published estimates for eDNA degradation. Measurements of local environmental conditions, consideration of environmental influence on eDNA detection, and quantification of local eDNA degradation rates will help interpret future eDNA surveillance results.
Main content:
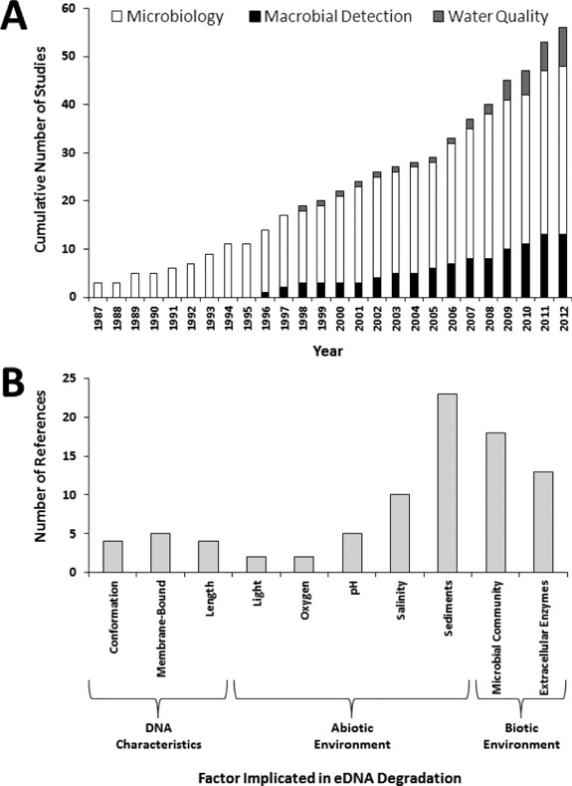
Figure 1. (A) Cumulative number of eDNA degradation studies over time. Macrobial detection studies considered eDNA for the purpose of detecting multicellular organisms. Microbiology studies examined genetic detection of single-celled organisms and extracellular DNA. Water quality studies included eDNA detection of fecal pollution. (B) Factors demonstrated to influence eDNA degradation and number of studies providing support. Note that individual studies could implicate multiple factors as drivers of eDNA degradation and appear in multiple columns.
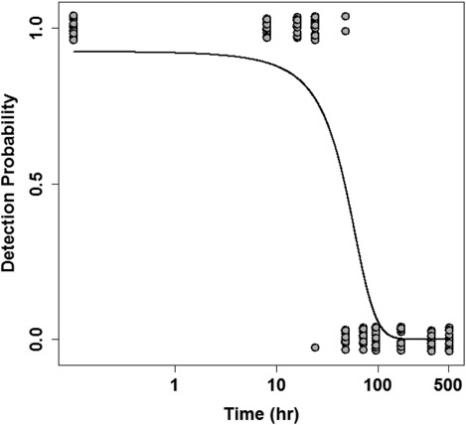
Figure 2. Logistic regression analysis of Common Carp eDNA detection probability (pooled over all three Goldfish treatments). Observation data equal 1 (detection) or 0 (no detection). Data are jittered along the y-axis, and the x-axis is displayed on a log scale to increase visibility of individual measurements. The line represents the best fit logistic function describing Common Carp eDNA detection probability (P = [(f(t))/(1 + f(t))], f(t) = 2.498 − 0.053t)).
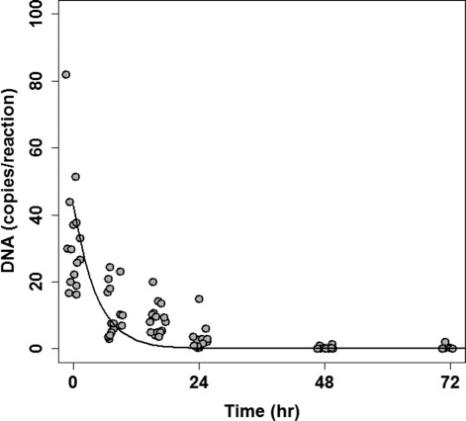
Figure 3. Quantification of Common Carp eDNA followed exponential decay over time (pooled over all three Goldfish treatments). Each datum indicates the average of three technical replicates for one mesocosm at one time, and data are jittered along the x-axis to improve visibility. Line represents the best fit exponential decay function describing Common Carp eDNA concentration (D(t)= 32.164 e−0.105t). Note that a qPCR reaction included 4 μL extracted DNA.
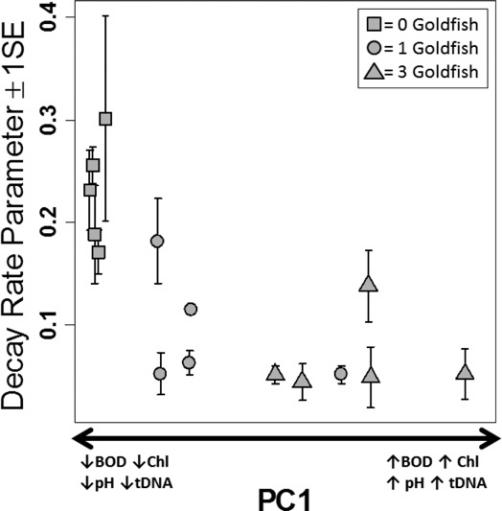
Figure 4. Estimated Common Carp eDNA decay rate decreased as environmental principal component 1 (PC1) increased.
Conclusion:
Given the importance of microbial metabolism as a driver of eDNA degradation documented in our literature review, we predicted that increased community metabolism resulting from the fertilization effect produced by Goldfish would increase eDNA degradation rates. We offer three possible explanations for the divergence between our prediction and the results. First, although some previous studies found no effect of sunlight exposure on eDNA degradation, our results implicate a decrease in light penetration by increased algal density as a potential driver of Common Carp eDNA degradation. Any increase in degradation rate that may have resulted from increased community metabolism in the treatments with Goldfish may have been outweighed by a decrease in degradation rate caused by reduced light. Second, Goldfish presence could have also reduced heterotrophic microbial degradation of Common Carp eDNA by providing a more preferred nutrient source through excretion. Goldfish-derived materials may have been a more nutritious substrate for microbial metabolism compared to Common Carp derived material, which would have been partly metabolized by the time of collection. Third, variations in abiotic environmental conditions may have also influenced metabolic activity of the heterotrophic microbial community, although this seems less likely than the explanations above. Previous studies have shown that deviations from neutral pH can reduce degradation rates, especially for substances that must be degraded with the aid of extracellular enzymes. For example, several studies documenting genetic detection of degrading leaf litter found decay rates negatively associated with increasing acidity (<5) and attributed declining decay rates to reduced levels of microbial and fungal activity. On the other hand, alkaline buffers (pH 8−9) are widely used in the laboratory to preserve DNA, and previous studies in terrestrial soils found no effect of pH ranging from 6.2 to 8.3 on their ability to retrieve and PCR amplify eDNA. The range in pH among treatments in our study (pH 9.2 to pH 10) were small relative to those described as biologically important in many previous studies and all treatments were alkaline (Table 1). Thus, it seems unlikely that pH drove the observed gradient of degradation rates in our experiment (Figure 4). Clearly, more research is needed on the influence of pH on eDNA degradation, employing a wider range of experimental pHs than was created in our experiment. Uncertainty remains regarding which environmental characteristics most strongly influence eDNA degradation. Our literature review illustrated that different factors can produce antagonistic or synergistic effects, and such complexity cannot be parsed out from our study design. Nevertheless, our experiment demonstrated that differences in environmental conditions influence the rate of eDNA degradation in aquatic systems, and our results suggest that environmental differences may be sufficient to explain the different eDNA degradation rates reported in the literature. Accordingly, measurements of local environmental conditions, consideration of environmental influence on eDNA detection, and quantification of local eDNA degradation rates will help interpret future eDNA surveillance results.
Article 2:
Title: Factors governing extracellular DNA degradation dynamics in soil
Download website:http://dx.doi.org/10.1111/1758-2229.12725
Abstract:
We examined the impacts of soil moisture, temperature, agricultural management and habitat type on the degradation dynamics of eDNA in soils. Synthetic eDNA was added to soil microcosms, and its disappearance over time was measured using both high-throughput sequencing and qPCR. The synthetic eDNA was degraded rapidly, but a small fraction remained detectable throughout the experiments (39–80 days). The eDNA degradation rate was positively correlated with moisture and temperature, but negatively correlated with soil organic carbon content. End-point stabilization of eDNA was highest at low moisture and temperature, but exhibited no relationship with soil organic carbon. Tilled soils had higher rates of degradation and less stabilization than no-till soils. Among different habitats we observed that forest soils had the slowest degradation rate, and meadow soils had the greatest stabilization of eDNA. While eDNA was detectable by qPCR in all treatments across all time-points, it became inconsistently detectable with high-throughput gene sequencing in less than 1 week. We conclude that eDNA degradation and stabilization dynamics vary with moisture, temperature and habitat characteristics, that small amounts of eDNA may persist in soils indefinitely, and that the ability of persistent eDNA to impact microbial community estimates depends on method sensitivity and experimental objectives.
Main content:

Fig. 1. Moisture has a significant impact on eDNA decay rate and stabilization in soil. The eDNA standard was added in equal amounts to all soils at time 0 and it was quantified in soils over time using both qPCR (A) and high-throughput DNA sequencing (B). Soils were incubated at room temperature with different levels of moisture as follows: 20% WHC (□), 50% WHC (○) and 80% WHC (Δ). Values are treatment averages (n = 4) for each time point. Solid lines in panel A indicate the best fitting exponential decay models for the data. The horizontal line in panel B indicates the limit of detection (LoD) estimated for DNA sequencing in this assay. The LoD for qPCR is not shown in panel A because it was 1000 gene copies per reaction and it falls below the x-axis.

Fig. 2. Temperature has a significant impact on eDNA decay rate and stabilization in soil. The eDNA standard was added in equal amounts to all soils at time 0 and it was quantified in soils over time using both qPCR (A) and high-throughput DNA sequencing (B). Soils were incubated at 50% WHC with different levels of temperature as follows: 4℃ (□), 20℃ (○) and 36℃ (Δ). Values are treatment averages (n = 4) for each time point. Solid lines in panel A indicate the best fitting exponential decay models for the data. The horizontal line in panel B indicates the limit of detection (LoD) estimated for DNA sequencing in this assay. The LoD for qPCR is not shown in panel A because it was 1000 gene copies per reaction and it falls below the x-axis.
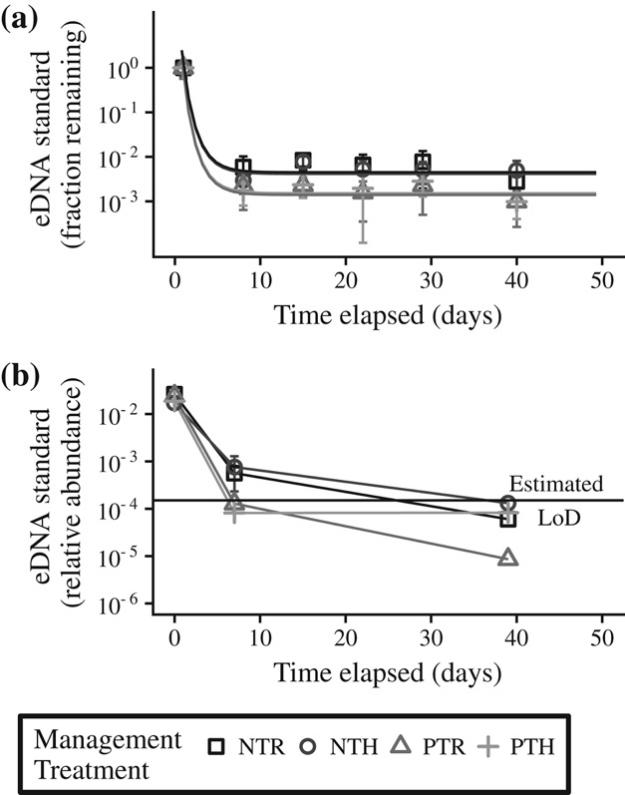
Fig. 3. Soil management has a significant impact on eDNA decay rate and stabilization in soil. The eDNA standard was added in equal amounts to all soils at time 0 and it was quantified in soils over time using both qPCR (A) and high-throughput DNA sequencing (B). Soils of different soil management history: no till – biomass returned (NTR, □), no till – biomass removed (NTH, ○), plow till – biomass returned (PTR, Δ) and plow till – biomass removed (PTH, +), were incubated at 50% WHC and at room temperature. Values are treatment averages (n = 4) for each time point. Solid lines in panel A indicate the best fitting exponential decay models for the data. The horizontal line in panel B indicates the limit of detection (LoD) estimated for DNA sequencing in this assay. The LoD for qPCR is not shown in panel A because it was 1000 gene copies per reaction and it falls below the x-axis.
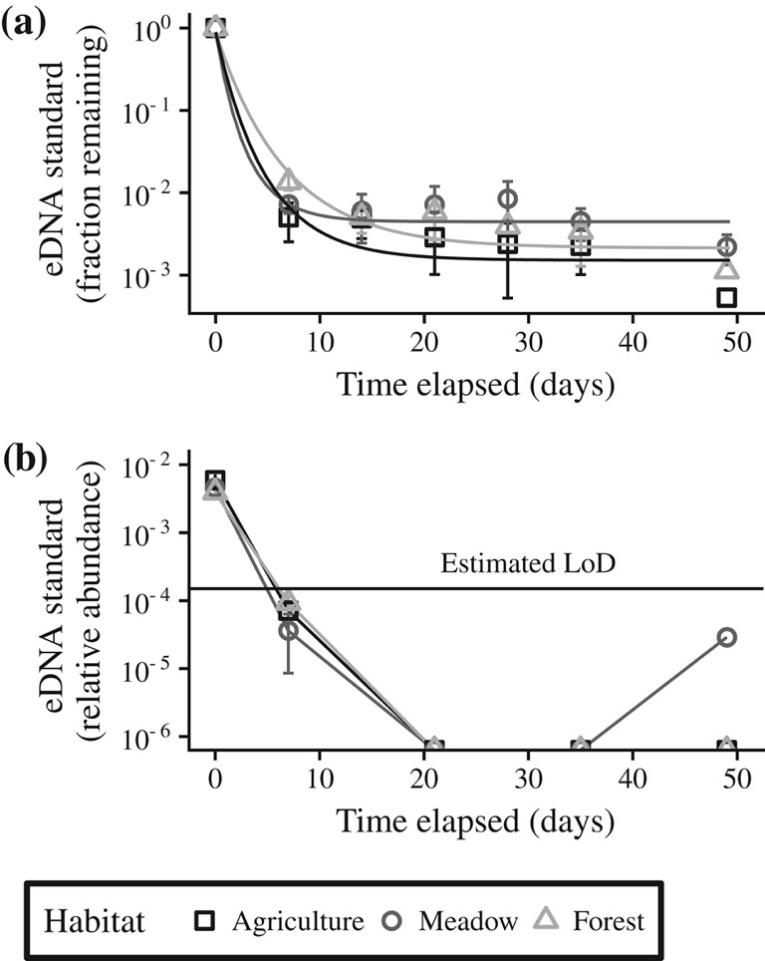
Fig. 4. Habitat has a significant impact on eDNA decay rate and stabilization in soil. The eDNA standard was added in equal amounts to all soils at time 0 and it was quantified in soils over time using both qPCR (A) and high-throughput DNA sequencing (B). Soils from different habitats: agricultural (□), meadow (○) and forest (Δ) were incubated at 50% WHC and at room temperature. Values are treatment averages (n = 4) for each time point. Solid lines in panel A indicate the best fitting exponential decay models for the data. The horizontal line in panel B indicates the limit of detection (LoD) estimated for DNA sequencing in this assay. The LoD for qPCR is not shown in panel A because it was 1000 gene copies per reaction and it falls below the x-axis.
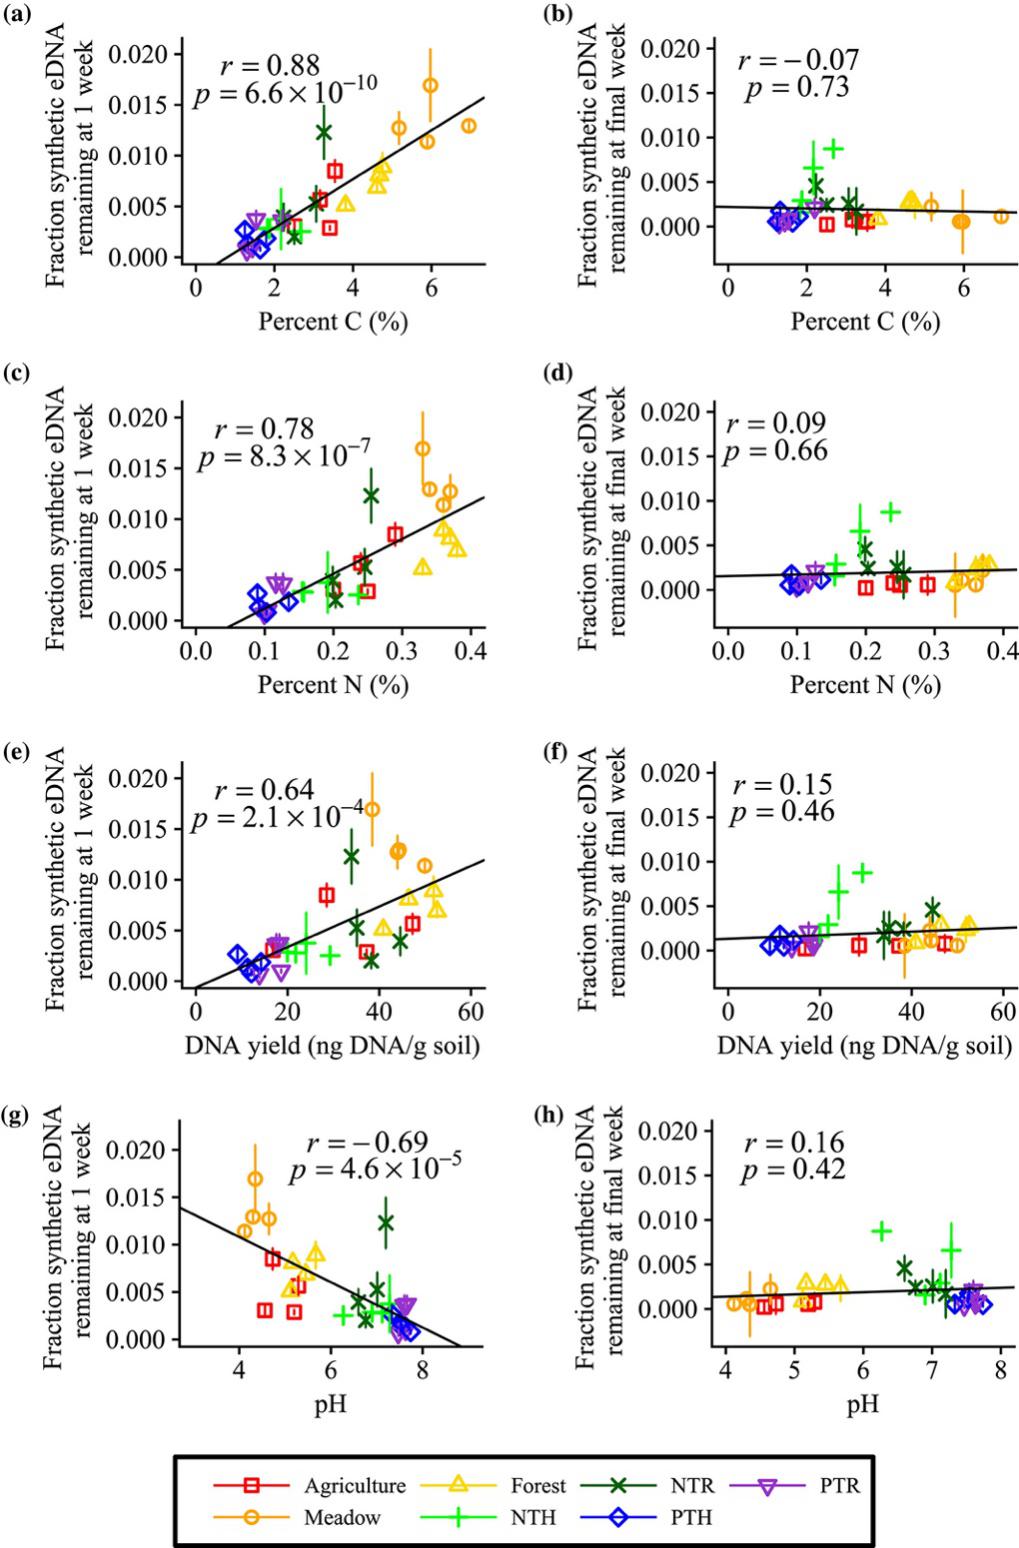
Fig. 5. The initial decay rate of eDNA correlated with soil properties such as total soil C (a), total soil N (c), total soil DNA (e) and soil pH (g), but end-point stabilization of eDNA did not correlate with any of these soil properties (b, d, f, h respectively). Symbols are defined in the legend provided. Pearson’s correlation coefficient (r) and corresponding p-values are provided.
Yueting Pan