Monitoring Enzyme Activity in Litter Decomposition on the Small Scales
Heterogeneity within forest soils including litter has been described at different scales, but rarely at the small scale. Here we asked whether the spatial heterogeneity at the scale of a single leaf, wood, fungal colonies and soil pores.
Article 1:
Scale 1: The single leaf
Title: Spatial heterogeneity of cellulolytic activity and fungal communities within individual decomposing Quercus petraea leaves
Download website:
https://www.sciencedirect.com/science/article/pii/S1754504816301027?via%3Dihub
Main contents:
Heterogeneity within forest topsoils including litter has been described at different scales, but rarely at the small scale. Here we asked whether the spatial heterogeneity of enzymatic activity can be linked to fungal community composition at the scale of a single Quercus petraea leaf. The activity of cellobiohydrolase (exocellulase) was measured over the surface of leaves at different stages of decomposition, and fungal communities from parts with high and low enzyme activity were characterized. Cellobiohydrolase activity increased with time and varied considerably across leaf surfaces. Highly diverse communities of fungi, specific for each stage of decomposition were observed within leaf sections of 1cm2. In still attached, but senescent leaves, where cellulosehydrolysis occurred only locally, parts of leaves with the highest cellulolytic activity were inhabited by a specific community of fungi, enriched in cellulolytic taxa and different from nonactive parts of the same leaves. In older litter, fungal communities in active and nonactive parts of leaves did not differ significantly.
Results:
1. The distribution of cellobiohydrolase activity across leaf surfaces was highly uneven in leaves of all ages (Fig. 1) spanning from no detectable activity to activity as high as 327 pmol min−1 cm−2 in senescent leaves, 408 pmol min−1 cm−2 in fresh litter, 597 pmol min−1 cm−2 in mid-stage litter and 796 pmol min−1 cm−2 in old litter. Overall, mean cellobiohydrolase activity increased significantly from 13 pmol min−1 cm−2 in senescent leaves to 107 pmol min−1 cm−2 in fresh litter and further to mid-stage and old litter, where activities were similar with the means of 199 and 204 pmol min−1 cm−2, respectively. On senescent leaves, more than 65% of the leaf surface did not show detectable cellobiohydrolase activity (Fig. 2). Typically, higher activities were detected on leaf edges and near stalks, indicating the areas where cellulose decomposition was initiated after leaf senescence (Fig. 1). Older leaves typically showed unimodal distribution of activities with a very low percentage of inactive area (Fig. 2). The mean bacterial to fungal rDNA copy ratio (B/F ratio) in both the active and nonactive spots was significantly different among leaf ages (p < 0.01) except for mid-stage and old litter (Fig. 3).
The fungal community was mostly composed of Ascomycota and Basidiomycota(Fig. 4). Ascomycota dominated in the early stages of leaf decomposition with a relative abundance over 95% in senescent leaves. The share of sequences of Basidiomycota increased with time and represented around 33% of sequences in the fresh litter and around 50% in the mid-stage and old litter. In the senescent leaves, most sequences belonged to the orders Helotiales (40%), Capnodiales (30%), Chaetothyriales (6%) and Dothideales (6%). Helotiales and Capnodiales were also abundant in the fresh litter, together with the basidiomycetous orders Filobasidiales (8%) and Atheliales (9%). The same orders also dominated in the mid-stage litter, where Agaricales (7%) increased. In the old litter, Agaricales represented the most abundant order (28%), followed by Thelephorales (11%; Fig. 4).
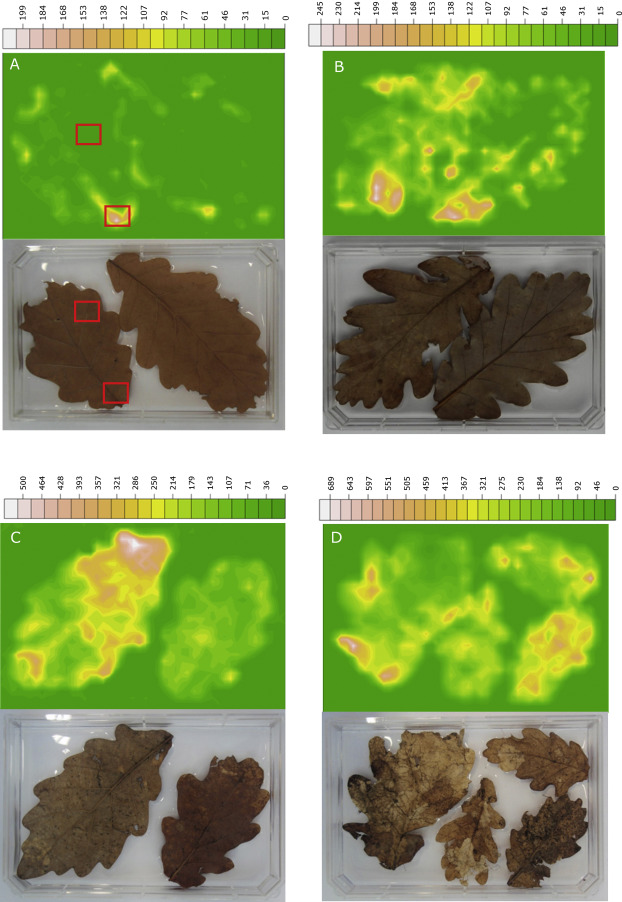
Fig 1. Visualization of cellobiohydrolase activity of Quercus petraea leaves. The heatmap with enzyme activity corresponds to the photographs of analysed, representative leaves: (A) senescent leaves, (B) fresh litter, (C) mid-stage litter, (D) old litter. Cellobiohydrolase activity is expressed in pmol min−1 cm−2.
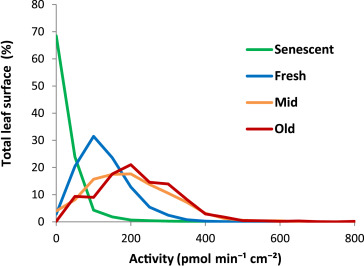
Fig 2. Distribution histogram of cellobiohydrolase activity across the surface of Quercus petraealeaves at various stages of decomposition. Data represent means of all leaves of each age class; cellobiohydrolase activity measured in pmol min−1 cm−2, the first category indicates no activity.
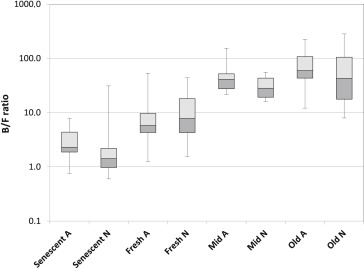
Fig 3. Ratio of bacterial/fungal rDNA copies in the active spots (A) and nonactive spots (N) of Quercus petraea leaves at various stages of decomposition. Boxes represent the first quartile, median, and third quartile, bars indicate minima and maxima.
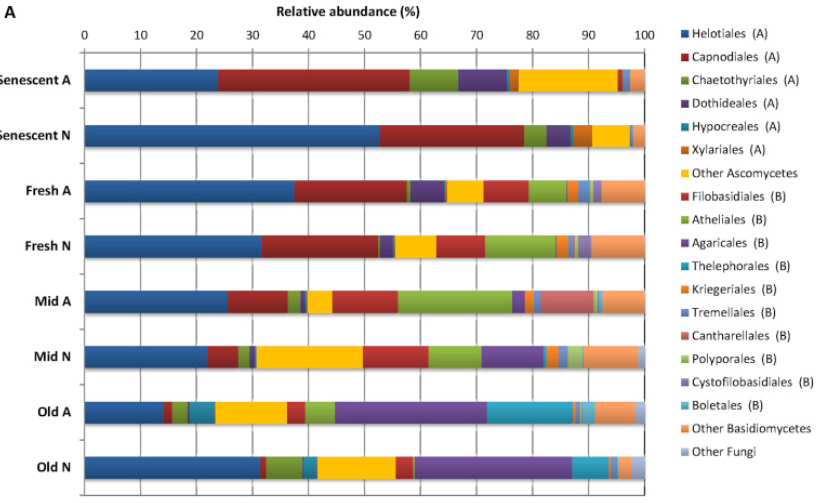
Fig 4.Composition of fungal communities in the active spots (A) and nonactive spots (N) of Quercus petraea leaves at various stages of decomposition at the level of orders. Data represent means of all leaves of each age class. Abbreviations: A – Ascomycota, B – Basidiomycota.
Conclusion:
In summary, the results of our study indicate that senescent leaves and litter are inhabited by a highly diverse community of fungi, specific for each stage of decomposition. In senescent leaves, where cellulose hydrolysis occurs only locally, the parts of leaves with high activity of exocellulase are inhabited by a different community of fungi than nonactive parts of the same leaves, and the former community is enriched in cellulolytic fungi. With data on fungal community composition and abundance at hand, the spatial variation in cellulolytic activity on Q. petraea leaves still appears largely stochastic, especially in litter after longer decomposition. The fact that bacterial biomass is equally high or even higher at locations with high cellulase activity points at their potential involvement in decomposition.
Article 2:
Scale 2: The fungal colonies
Title: Scaling Down the Analysis of Environmental Processes: Monitoring Enzyme Activity in Natural Substrates on a Millimeter Resolution Scale
Download website:
https://aem.asm.org/content/78/9/3473
Fig.1 Distribution of hydrolytic enzymes across fungal colonies, fungus-colonized wood sections, and decaying leaves. Distribution of β-glucosidase (a) and phosphomonoesterase (b) across the colonies of the saprotrophic basidiomycete Hypholoma fasciculare on malt extract agar, β-glucosidase (c) and cellobiohydrolase (d) over a cross-section of a Betula pendula branch colonized by wood-decomposing fungi, including Fomes fomentarius (fruit body), N-acetylglucosaminidase (e), and cellobiohydrolase (exocellulase) (f) over the surface of Quercus petraea leaves decomposing for 10 months on the forest floor surface. Enzyme activities are expressed in nmol·h−1·cm−2.
Article 3:
Title: Spatial patterns of extracellular enzymes: Combining X-ray computed micro-tomography and 2D zymography
Download website:
https://www.sciencedirect.com/science/article/pii/S0038071719301610?via%3Dihub
Main contents:
Linking the distribution of enzyme activity to the size and properties of soil pores is a necessary prerequisite for mechanistic understanding of soil biochemical processes. In this study we used soil 2D zymography and X-ray computed tomography (μCT) to assess the relationship between enzymes and pores. The objectives of the study were (i) to assess spatial distribution patterns in the activity of six enzymes contributing to C, N and P cycles, namely, cellobiohydrolase, β-glucosidase, xylanase acid phosphatase, leucine aminopeptidase, and N-acetylglucosaminidase, in soils from five long-term land use and management practices, (ii) to study the correlation between enzyme activities and μCT information, i.e., pore characteristics and image grayscale values, and (iii) to explore the potential use of soil 2D zymography in predicting enzyme activities within 3D soil cores. 3D pore-size distributions were obtained from μCT images of 13 intact soil cores and then 8–15 2D zymography maps were taken from each core. Spatial distributions in the activities of all studied enzymes were auto-correlated; the spatial correlation ranges were equal to ∼7–8 mm. The relative activity of all enzymes was positively associated within 60–180 μm Ø pores. Combining 3D μCT information with 2D zymography maps visualized the overall patterns of enzyme activity distributions with respect to soil pores and particulate organic matter locations. Based on the findings we propose a conceptual scheme relating localization of microorganisms, enzymes and substrates to pores of different size ranges. Specifically, we suggest that pores in the tens of microns size range represent optimal microbial habitats, and as such are associated with greater microbial abundance, leading to high enzyme production and activity.
Results:
In most soil slices the studied EE were negatively correlated to grayscale values from X-ray μCT images (Fig. 1). NAG and β-glucosidase were the two enzymes with the strongest associations with the grayscale values (Fig. 1). For the other two enzymes involved in C cycle, i.e., cellobiohydrolase and xylonase, the associations with the grayscale values were relatively weak. With the exception of a few slices, acid phosphatase was not correlated with grayscale values.
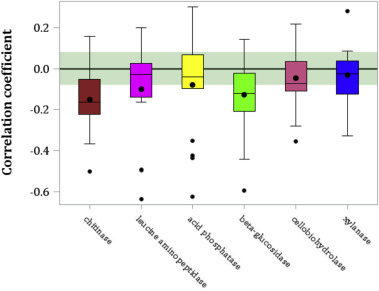
Fig 1. Correlation coefficients between μCT grayscale values from solid voxels and standardized values of the studied six enzymes. Horizontal lines and dots within the boxes mark medians and means, respectively, while outside dots mark outliers. Shaded area marks correlation coefficients that are not significantly different from zero (p < 0.05). Note that negative correlations signify that higher EE levels were present in darker (lower grayscale value) areas of μCT images, which are in part associated with greater presence of organic materials.
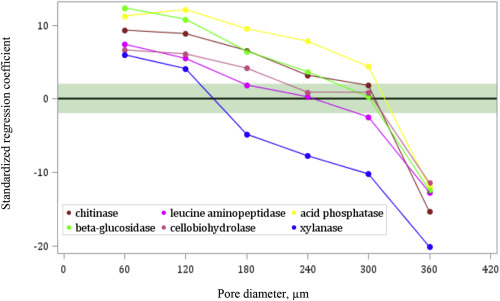
Fig 2. Standardized linear regression slopes from ANCOVA relating enzyme activity with volumes of pores of different sizes across all studied sites. Shaded area marks correlation coefficients that are not significantly different from zero (p < 0.05).
Associations with pores of various sizes varied among the six enzymes, but positive relationships with 60–180 μm Ø pores and subsequent decrease with further increasing pore sizes was present in all EEs (Fig. 2). For 60 μm pores, the associations were the highest for β-glucosidase, closely followed by acid phosphatase, and then by NAG. Associations with 120 μm pores were the strongest for phosphatase, followed by β-glucosidase, and NAG. Associations with pores of 180–300 μm size range were substantially stronger for acid phosphatase as compared to the other EEs. All enzymes were negatively associated with pores 360 μm (Fig. 2).
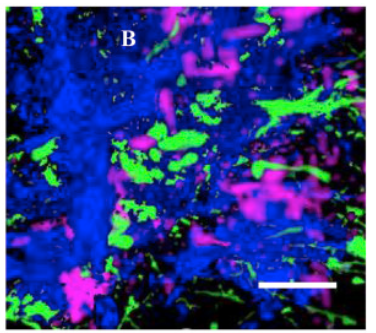
Fig 3. A section of a 3D map of β-glucosidase (pink) distribution within an intact soil core obtained from regression kriging along with soil pores (blue) and particulate organic matter (green). White scale bar represents 5 mm. (For interpretation of the references to colour in this figure legend, the reader is referred to the Web version of this article.)
At the studied scales of a few mm, within non-rhizosphere soil matrix, we found spatial autocorrelations in distributions of all studied EE. Observed spatial patterns are a function of spatial patterns in the distributions of microbial producers, but also of nature, availability, and diffusion properties of EE substrates.
Positive associations between pores with 60–180 μm diameters and relative EE activities were found for all studied enzymes, across all five studied land use and management practices. Apparently, micro-scale areas with prevalence of such pores experience elevated levels of microbial activities leading to EE production and are the potential hotspots of C, N and P cycling. The results suggest that in the studied soils pores of this size range serve as a prime habitat for soil microbial communities.
Contact: Cao Tingting
E-mail: 1274467369@qq.com