影响eDNA降解的因素研究
Article 1: Effects of Microbial Activity and Environmental Parameters on the Degradation of Extracellular Environmental DNA from a Eutrophic Lake
Download website: https://www.mdpi.com/1660-4601/16/18/3339/htm#
Main contents:
Extracellular DNA (exDNA) pool in aquatic environments is a valuable source for biomonitoring and bioassessment. However, degradation under particular environmental conditions can hamper exDNA detectability over time. In this study, we analyzed how different biotic and abiotic factors affect the degradation rate of extracellular environmental DNA using 16S rDNA sequences extracted from the sediment of a eutrophic lake and Anabaena variabilis cultured in the laboratory. We exposed the extracted exDNA to different levels of temperature, light, pH, and bacterial activity, and quantitatively analyzed the concentration of exDNA during 4 days. The solution containing bacteria for microbial activity treatment was obtained from the lake sediment using four consecutive steps of filtration; two mesh filters (100 μm and 60 μm mesh) and two glass fiber filters (2.7 μm and 1.2 μm pore-sized). We found that temperature individually and in combination with bacterial abundance had significant positive effects on the degradation of exDNA. The highest degradation rate was observed in samples exposed to high microbial activity, where exDNA was completely degraded within 1 day at a rate of 3.27 day−1. Light intensity and pH had no significant effects on degradation rate of exDNA. Our results indicate that degradation of exDNA in freshwater ecosystems is driven by the combination of both biotic and abiotic factors and it may occur very fast under particular conditions.
Results:
The concentration of exDNA declined rapidly after day 1 at all temperatures. The highest degradation rate (0.2547 ± 0.0536 day−1, p = 0.0177) was observed at 35 °C, in which approximately 60% of exDNA was degraded by the end of the experiment (Table 2, Figure 1B). No significant degradation was observed in control treatment (5 °C). There were statistically significant differences between 35 °C and other temperatures, including control (5 °C), starting at day 2 (F(3,8) = 15.75, p = 0.01) (Figure 1A). The concentration of exDNA incubated at 25 °C was different from that of the control treatment only at day 3 (F(3,8) = 14.66, p = 0.001). By the end of experiment, exDNA was degraded by up to 60% from the initial concentration in both 25 °C and 35 °C treatments. The remaining exDNA concentrations in these treatments were significantly lower (4.56 ± 0.19 × 10¹¹ copies/μg DNA, p = 0.001, and 5.15 ± 0.38 × 10¹¹ copies/μg DNA, p = 0.002, for 25 °C and 35 °C, respectively) than those incubated at 5 °C and 15 °C at the end of the experiment (Figure 1B).
We found that higher bacterial abundance resulted in more degradation of exDNA, and microorganism activity had an interaction with high temperature, which in concert strongly accelerated the degradation to the level of the limit of detection as early as 24 h after incubation (Figure 2). The slowest degradation was observed in samples exposed to microbial activity at 5 °C, where approximately 90% of the initial exDNA remained by the end of experiment (Figure 2D). Bacterial treatments did not significantly influence the degradation of exDNA concentration at this low temperature (F(3,20) = 1.542, p = 0.234). On the other hand, when temperature was elevated to 25 °C, the undiluted bacterial solution (1.6 ± 0.12 × 10⁷ cells/mL) caused a rapid decline in exDNA after 2 days, from there on exDNA was not detected anymore (Figure 2B). Similarly, the bacterial solution diluted by 10−2 (1.6 ± 0.12 × 10⁵ cells/mL) drastically reduced exDNA levels at day 3, reaching undetectable levels at the fourth day (Figure 2B). The effect of microbial activity was further enhanced by high temperature, in which exDNA degradation rate was the highest at 35 °C (Figure 2C). At this temperature, the undiluted bacterial treatment strongly reduced exDNA during the first 24 h of experiment (Figure 2C, Table 3).
The amount of exDNA declined within 1 day in all light treatments, probably because of the bottle effect (i.e., adhesion) [46]. In all light treatments, there were no notable differences in the degradation pattern during the first 3 days of experiment. We did not find any significant differences in exDNA degradation among the different light intensity levels at 5 °C throughout the experimental period, indicating a great persistence of exDNA under these conditions (Figure 3A,C). However, at the end of the experiment at 35 °C, there was a significant difference in percentage of degraded exDNA (F(3,8) = 4.075, p = 0.050) between samples kept in the dark and those exposed to 50 µmol m−2·s−1 (Figure 3B,D). The lowest exDNA concentration was detected in the treatment of 50 µmol m−2 s−1 under 35 °C, with the amount of 32.9 ± 1.70 × 10¹¹ copies/μg DNA on the last day (Figure 3B).
Different pH treatments had no significant effects on the degradation rate of exDNA (Figure 4). The remaining exDNA concentration at the end of the experiment at both 5 °C (F (2,6) = 2.956, p = 0.128) and 35 °C (F (2,6) = 0.365, p = 0.709) did not differ (Figure 4A,B) and showed long persistence at all pH conditions. In terms of total degradation, we found that exDNA was more degraded at pH 10 than at pH 7 when incubated at 5 °C (F (2,8) = 8.341, p = 0.019) (Figure 4C), in which 37% of the initial exDNA was degraded.
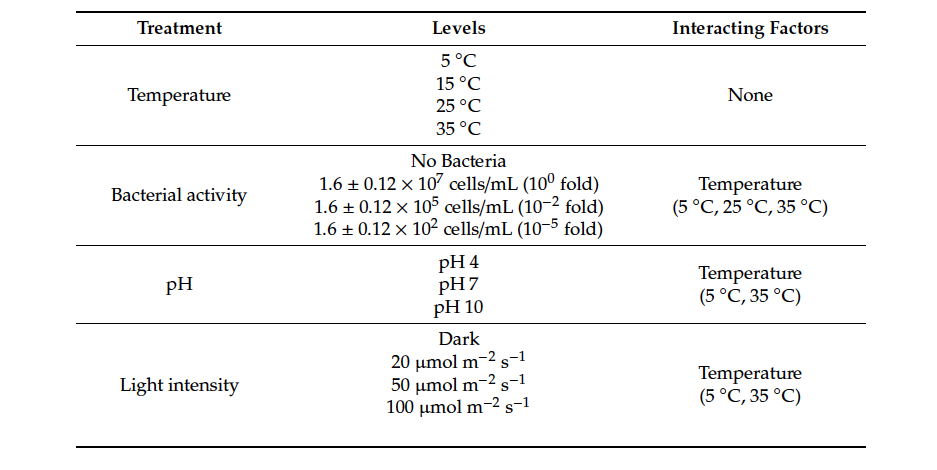
Table 1. The summary of the treatments and their interacting factors. Other treatments than light
intensity were conducted in the dark and all treatments were run separately in triplicate over the 4 days.
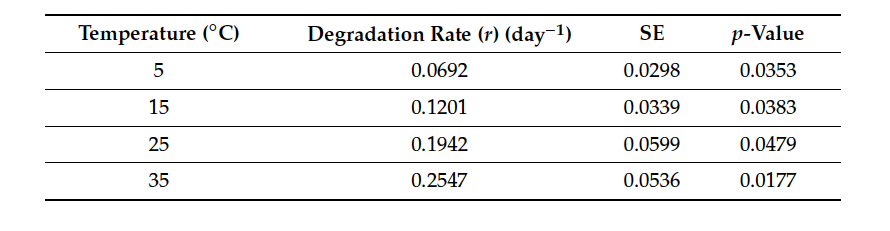
Table 2. Degradation rates of exDNA under different temperature treatments (5℃, 15℃, 25℃, and 35℃) during incubation for 4 days. Degradation rates were estimated by fitting the number of copies of each set of DNA to an exponential decay curve. SE: standard error.
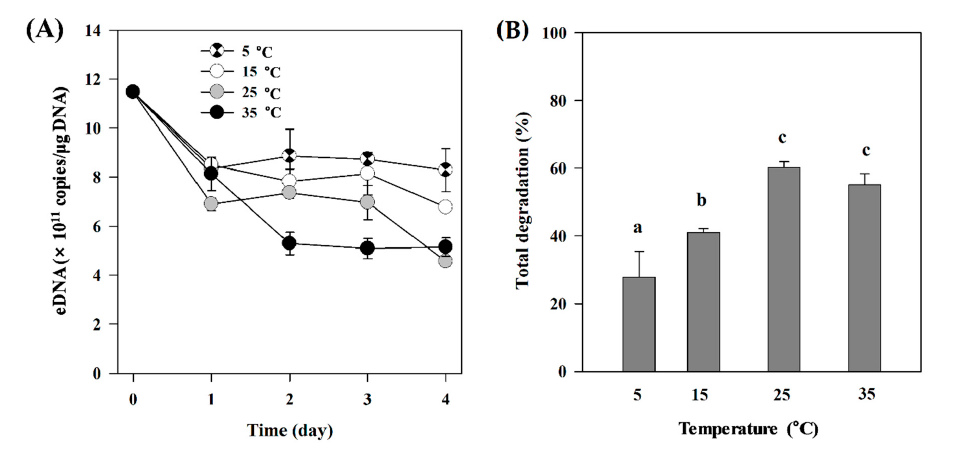
Fig. 1. ExDNA concentration in samples exposed to different temperatures. (A) Changes in exDNA concentration detected under different temperature treatments (5 °C, 15 °C, 25 °C, and 35 °C). (B) Total exDNA degradation (%) at the end of the experiment (4 days). Different letters indicate statistically significant differences defined by p < 0.05 between treatments. Error bars represent the standard deviations among replicates within the treatments.
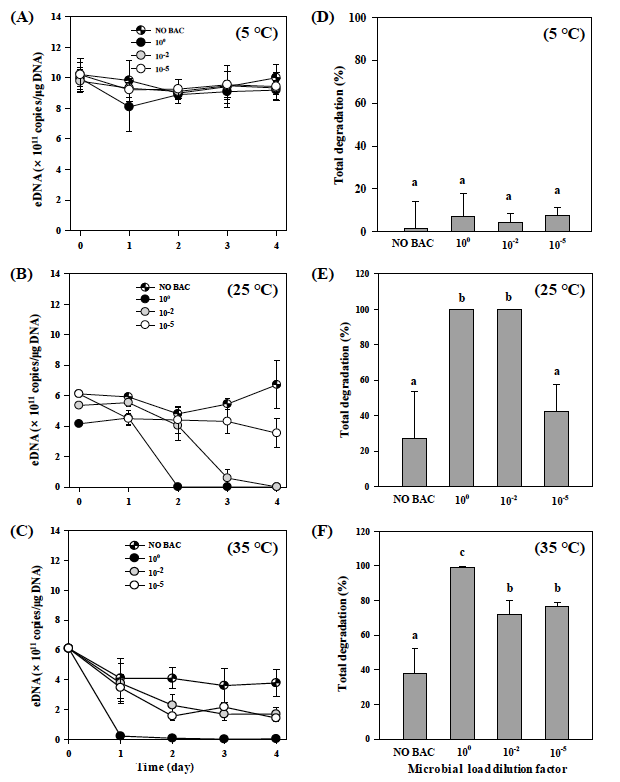
Fig. 2. ExDNA concentration in samples exposed to different bacterial abundance and temperatures. (A–C) Changes in exDNA concentration detected under different bacterial treatments (no bacteria added and diluted bacterial solutions by 100, 10−2, and 10−5-fold) at different temperatures (5 °C, 25 °C, and 35 °C). Average bacterial abundance before dilutions was 1.6 ± 0.12 × 10⁷ cells/mL. (D–F) Total exDNA degradation (%) at the end of the experiments (4 days). NO BAC: no bacteria added. Different letters indicate statistically significant differences defined by p < 0.05 between treatments. Error bars represent the standard deviations among replicates within treatments.
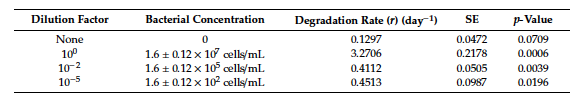
Table 3. Degradation rates of exDNA under different bacterial treatments at 35 °C during incubation for 4 days. Three serial dilutions of 100, 10−2, 10−5 fold were made from the prepared bacterial solution. Average bacterial abundance in solution before dilution was 1.6 ± 0.12 × 10⁷ cells/mL. Degradation rates were estimated by fitting the number of copies of each set of DNA to an exponential decay curve. SE: standard error.
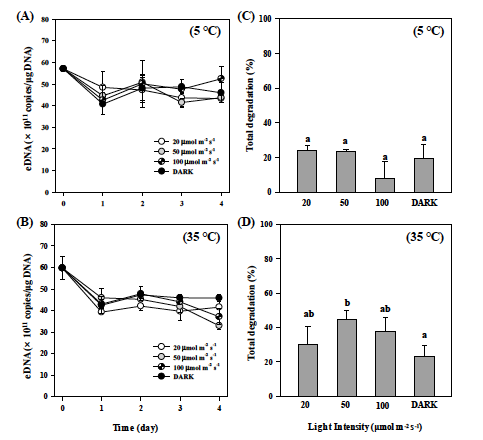
Fig. 3. ExDNA concentration in samples exposed to different light intensity levels and temperatures. (A,B) Changes in exDNA concentration detected under different light treatments at different temperatures (5 °C and 35 °C). (C,D) Total exDNA degradation (%) at the end of the experiments (4 days). Different letters indicate statistically significant differences defined by p < 0.05 treatments between treatments. Error bars represent the standard deviations among replicates within treatments.
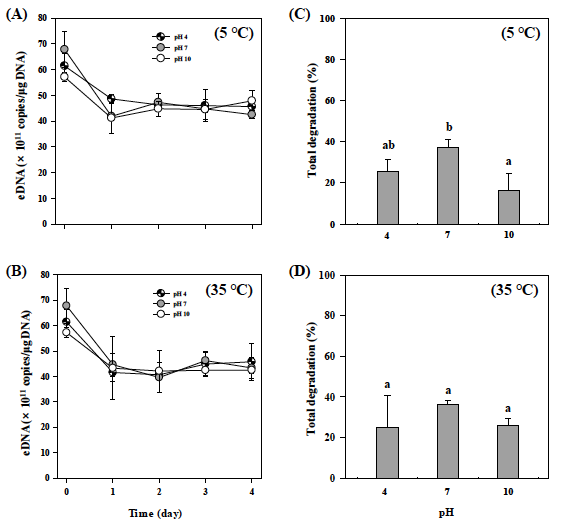
Fig. 4. ExDNA concentration in samples exposed to different pH levels combined and temperatures. (A,B) Changes in exDNA concentration detected under different pH levels at different temperatures (5 °C and 35 °C). (C,D) Total exDNA degradation (%) at the end of the experiments (4 days). Different letters indicate statistically significant differences defined by p < 0.05 between treatments. Error bars represent the standard deviations among replicates within treatments.
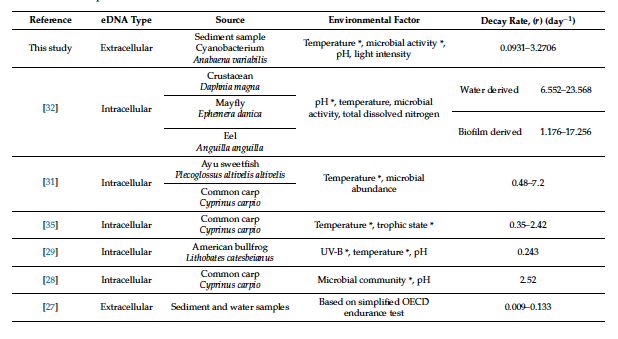
Table 4. Comparison of eDNA decay rates among different eDNA types, sources, and environmental factors. * indicate the factors that had a significant effect on eDNA degradation in the respective study. eDNA: Environmental DNA, UV-B: Ultraviolet B light, OECD: Organization for Economic Co-operation and Development.
Conclusion : This study demonstrated that different environmental conditions can affect exDNA degradation rate. Among all factors tested, temperature and microbial activity showed the strongest positive effects on degradation rate of exDNA within a short period of time. Even though light intensity and pH did not significantly influence exDNA degradation rate, combined treatment of temperature with these factors accelerated the exponential decay. We expect that interaction between various environmental factors under natural settings could reduce exDNA detectability over time. Using controlled conditions simulating a range of natural freshwater ecosystem parameters, our results provide a new insight on the degradation rate of exDNA, whose fast degradation occurs within 1 or 2 days. Our results provide evidence that supports the understanding of factors underlying degradation of extracellular eDNA and might be useful in further research on extracellular eDNA detectability in natural freshwater environments.
Article 2: Quantifying effects of UV-B, temperature, and pH on eDNA degradation in aquatic microcosms
Download website: https://www.sciencedirect.com/science/article/pii/S0006320714004637
Main contents:
Environmental DNA (eDNA) degradation is a primary mechanism limiting the detection of rare species using eDNA techniques. To better understand the environmental drivers of eDNA degradation, we conducted a laboratory experiment to quantify degradation rates. We held bullfrog (Lithobates catesbeianus) tadpoles in microcosms, then removed the tadpoles and assigned the microcosms to three levels each of temperature, ultraviolet B (UV-B) radiation, and pH in a full factorial design. We collected water samples from each microcosm at six time steps (0 to 58 days). In all microcosms, most degradation occurred in the first three to 10 days of the experiment, but eDNA remained detectable after 58 days in some treatments. Degradation rates were lowest under cold temperatures (5 °C), low UV-B levels, and alkaline conditions. Higher degradation rates were associated with factors that contribute to favorable environments for microbial growth (higher temperatures, neutral pH, moderately high UV-B), indicating that the effects of these factors may be biologically mediated. The results of this experiment indicate that aquatic habitats that are colder, more protected from solar radiation, and more alkaline are likely to hold detectable amounts of eDNA longer than those that are warmer, sunnier, and neutral or acidic. These results can be used to facilitate better characterization of environmental conditions that reduce eDNA persistence, improved design of temporal sampling intervals and inference, and more robust detection of aquatic species with eDNA methods.
Results:
Estimated concentration of eDNA in microcosms declined rapidly, with 80–90% of the observed degradation occurring in the first three days after tadpole removal (Fig. 2); however, appreciable amounts of eDNA (>5% of initial concentration) were detected in 53 (of 81) microcosms at Day 3, 35 at Day 10, 21 at Day 21, 13 at Day 35, and 3 at Day 58.
Total eDNA from all sources at Day 0 ranged from 12.55 to 164.53 ng per 250 ml, while starting concentrations of bullfrog eDNA ranged from 0.06 to 5.83 ng DNA per 250 ml water sample. Initial (Day 0) concentrations of bullfrog eDNA did not differ among levels of temperature, pH, and UV-B (Temperature: F(2,80) = 0.47; P = 0.63; pH: F(2,80) = 1.65, P = 0.20; UV-B: F(2,80) = 0.06, P = 0.94). We found no evidence that starting concentration of bullfrog DNA affected degradation rate (R2 = 0.02, P = 0.13).
Negative control microcosms (6 of 9) tested positive at 1–3 time steps for minute amounts of tadpole eDNA. This apparent cross-contamination was at very low levels (max = 0.49 pg DNA/250 ml sample) and short-lived (6 microcosms at Day 0, 4 microcosms at Day 3, 1 microcosm at Day 10, and 0 microcosms throughout the remainder of the experiment). Our microcosms were in close proximity to one another (0.1–2 m) within each growth chamber and it is possible that small water droplets were carried between microcosms through aeration, most likely at the outset of the experiment before microcosms were covered with plastic wrap. This issue also occurred in a similar eDNA degradation experiment (Barnes et al., 2014). Because the amounts of eDNA in control microcosms were extremely small, disappeared within the first three time steps, and were detected in all levels of the three treatment factors, it is unlikely that cross-contamination affected the observed patterns of eDNA degradation throughout the experiment.
Across all treatments, temperature exhibited a strong influence on the amount of eDNA detected over time (Fig. 3a; one-way ANOVA F(2,78) = 9.85, P = 0.002). Degradation rate was significantly lower in the 5 °C treatment compared with 20° and 35 °C treatments. Overall degradation rate was higher under pH 4 compared with pH 10 (Fig. 3b; one-way ANOVA F(2,78) = 3.88, P = 0.025). UV-B did not affect degradation rate when considered across all treatments of pH and temperature (Fig. 3c; one-way ANOVA F(2,78) = 1.86, P = 0.162).
The full linear regression model with all main effects and interactions (Table 2) was fit to the data (R2 = 0.52, F = 6.67, P < 0.001). All factors and interactions except pH significantly influenced degradation rate; however, pH had an interactive effect on degradation rate with both temperature and UV-B. The influence of interactions in the model indicate that, while temperature and UV-B affect degradation rate, their effects differ depending on the levels of the other factors. Independently, temperature and UV-B had positive effects on degradation rate, but the direction of the effect reversed when interactions with the other factors were included.
We found that the exponential decay model represented a high level of variation in the data (F(2,480) = 377.76, P < 0.001). The degradation rates (r) estimated from the exponential decay model ranged from 0.05 to 0.34 and were lowest for 5 °C for all levels of pH and UV-B (Fig. 4). Estimated time to reach 5% of initial eDNA concentrations was correspondingly highest in low temperature treatments, and ranged from <1 day to 54 days over all treatments. Across all treatments, we estimated a degradation rate of 0.243 ± 0.070, indicating that bullfrog eDNA concentrations decreased by approximately 24% per day.
Total eDNA from non-bullfrog sources ranged from 1.87 to 256.09 ng eDNA/μl (compared to 0 to 5.83 ng bullfrog eDNA/μl) and did not significantly change over the course of the experiment (Fig. 5; R2 = 0.004, F = 0.10, P = 0.75).
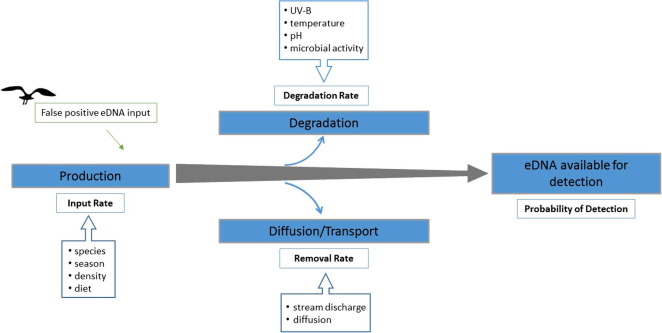
Fig. 1. Conceptual model of factors affecting eDNA detection. Following input of eDNA into an aquatic system, eDNA is removed from the system through degradation and by diffusion and transport processes, reducing the amount available for eDNA detection. Arrow boxes identify some of the biotic and abiotic factors that influence the production, degradation, and diffusion/transport processes. In some situations, it is possible that DNA brought to the sampling site from external sources (including movement by humans, vehicles, or animals) can interfere with estimates of true production by the target species and thus lead to false positive detections.
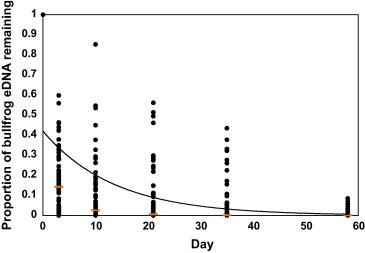
Fig. 2. Proportion of American bullfrog (Lithobates catesbeianus) eDNA remaining for 81 microcosms from 0 to 58 days following bullfrog tadpole removal. Horizontal lines represent the median proportion remaining in the sample. Day zero represents the initial amount of detectable bullfrog eDNA in each microcosm
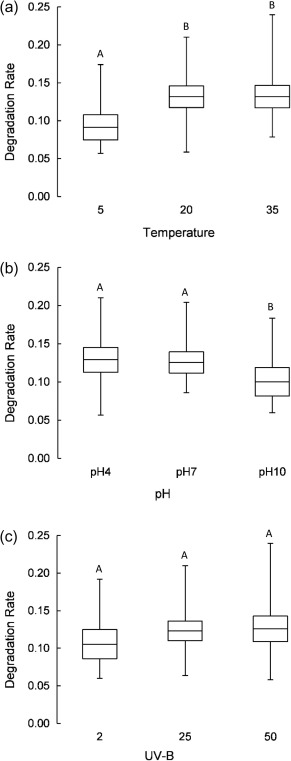
Fig. 3. Effects of (a) temperature, (b) pH, and (c) UV-B radiation on rate of eDNA degradation. Degradation rate represents the rate of change in eDNA detected from Day 0 to Day 58. Horizontal bars in box plots represent mean degradation rates, and upper and lower ends of boxes represent upper and lower 95% confidence intervals. Factor levels with the same letter are not significantly different. Temperature is measured in degrees Celsius (°C). UV-B is measured in kilojoules per square meter per day (kJ/m2/day).
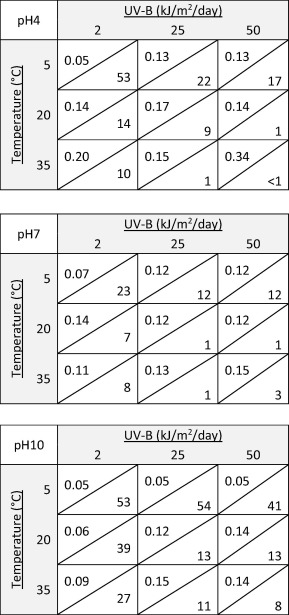
Fig. 4. Estimated within-treatment degradation rate (above diagonal) and estimated number of days for eDNA to fall below 5% of initial quantity (below diagonal) for each full factorial treatment of pH, temperature, and UV-B radiation. Degradation rate and days to 5% were estimated from exponential decay function for bullfrog eDNA.
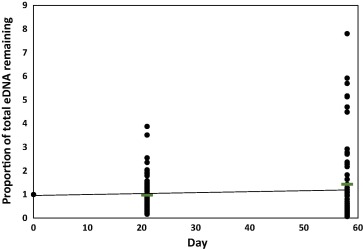
Fig. 5. Proportion of total non-bullfrog eDNA remaining for 81 microcosms at 0, 21, and 58 days following bullfrog tadpole removal. Horizontal lines represent the median proportion remaining in the sample. Day zero represents the initial amount of detectable eDNA in each microcosm.
Conclusion : The results of this experiment indicate that aquatic habitats that are colder, more protected from solar radiation, and more alkaline are likely to hold detectable amounts of eDNA longer than those that are warmer, sunnier, and neutral or acidic. As single factors, warmer temperatures and acidity also degraded eDNA faster while relationships with UV-B were more difficult to discern independently. Factors that contribute to favorable environments for microbial activity (higher temperatures, neutral pH, moderate UV-B) were related to higher degradation rates, lending support to the conclusion that some effects of these factors are mediated in part by biological processes. Although our experiment was conducted under controlled conditions, the levels of temperature, pH, and UV-B we selected are representative of a wide range of aquatic systems. We expect that the general patterns we found in the laboratory for the relative effects of each factor on eDNA persistence will extend to natural environments. Within the environmental conditions in this study, the variation in the length of time eDNA is predicted to be detectable after the target organism was removed was <1 to 54 days. Because effective eDNA sampling depends on identifying the window of highest probability of detecting the target species, the wide range of predicted persistence times underscores the importance of characterizing degradative conditions to best design sampling intervals and understand the temporal inference of positive and negative detections in each study system. We believe that, with improved understanding of factors influencing eDNA production, transport, degradation, and other mechanisms of removal, eDNA will be an increasingly powerful tool for accurate, robust detection and monitoring of sensitive, rare, or elusive species.
Yueting Pan