Enzymatic degradation of extracellular DNA exposed to chlorpyrifos and
chlorpyrifos-methyl in an aqueous system
Download website: https://www.sciencedirect.com/science/article/pii/S0160412019316150
Abstract: The persistence of extracellular DNA (eDNA) is crucial for ensuring species diversity and ecological function in aquatic systems. However, scarce information exists about the impact of pesticides on eDNA, although they often co-exist in the aquatic environment. Using a variety of spectroscopic analyses, eDNA degradation and the associated alterations in DNA secondary structure was investigated by exposing DNase I to tested DNA in the presence of chlorpyrifos, a commonly used organophosphate pesticide. Molecular dynamics simulation was used to explore the weak interactions between the tested DNA and chlorpyrifos. The results indicated that chlorpyrifos significantly enhanced DNA degradation without affecting the enzyme activity of DNase I in an aqueous system. Spectroscopic experiments confirmed that chlorpyrifos and the analog chlorpyrifos-methyl could bind with DNA to cause the bases noncovalent stacking interaction. Molecular simulations further demonstrated that pesticide binding with DNA molecules caused widening of the DNA grooves and destruction of the hydrated layer, which
enhanced DNA degradation. The findings presented herein provide novel insight into the genotoxicity and ecotoxicity of chlorpyrifos and chlorpyrifos-methyl, as well as their impacts on DNA persistence in aquatic environments.
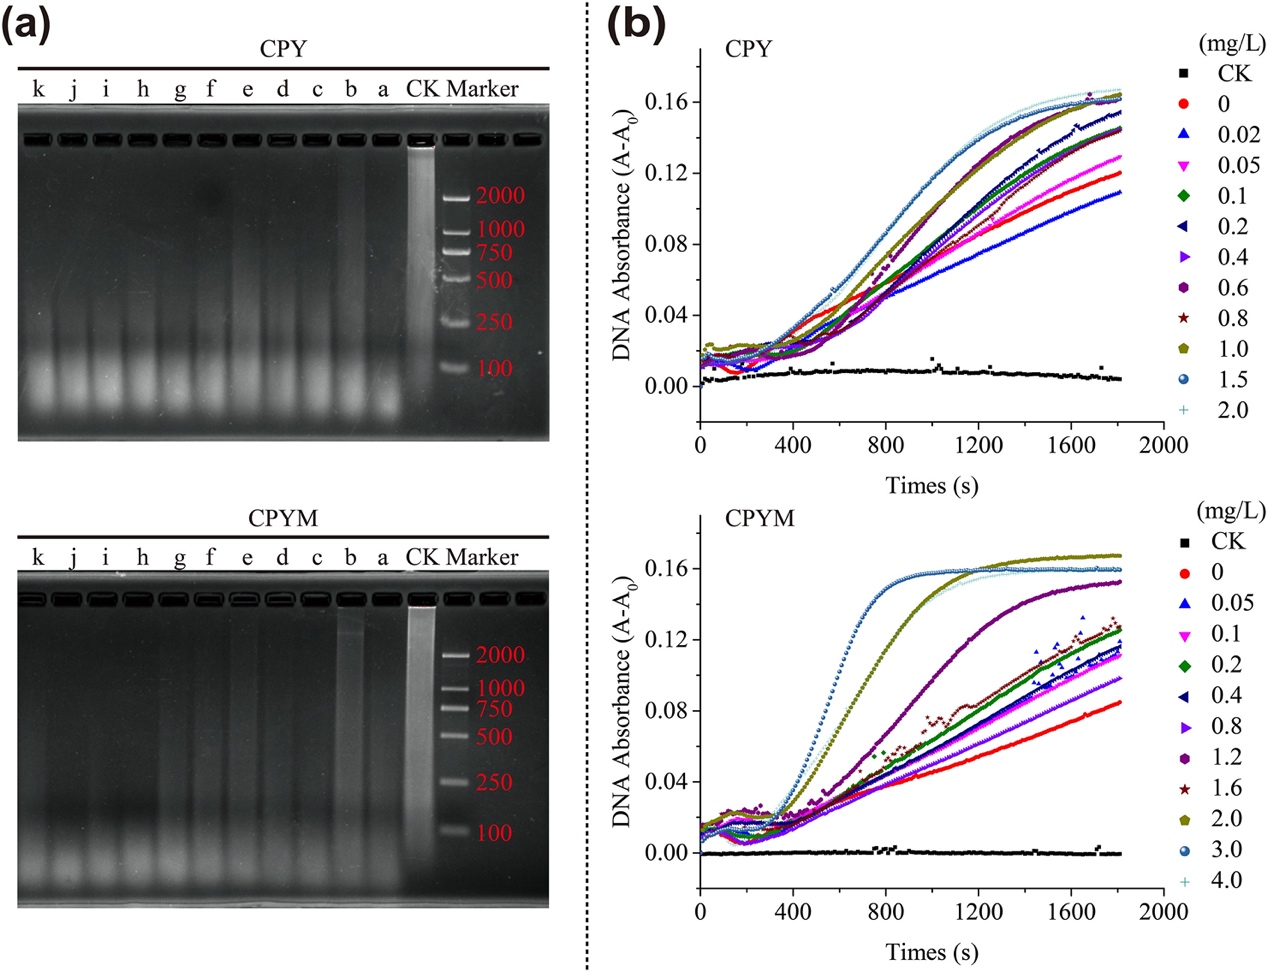
Fig. 1. Effects of the pesticides chlorpyrifos (CPY) or chlorpyrifos-methyl (CPYM) on DNA degradation. a, Gel electrophoresis of DNA fragments. CK represents the control treatment without DNase I. Letters a to k represent CPY concentrations of 0, 0.02, 0.05, 0.1, 0.2, 0.4, 0.6, 0.8, 1.0, 1.5, and 2.0 mg/L and CPYM concentrations of 0, 0.05, 0.1, 0.2, 0.4, 0.8, 1.2, 1.6, 2.0, 3.0, and 4.0 mg/L, respectively. b, Increase in DNA ultraviolet light absorbance caused by DNase I in the presence of CPY (top) and CPYM (bottom), with their concentrations presented on the right y–axis. A and A0 represent DNA ultraviolet light absorbance in the absence and presence of DNase I, respectively.
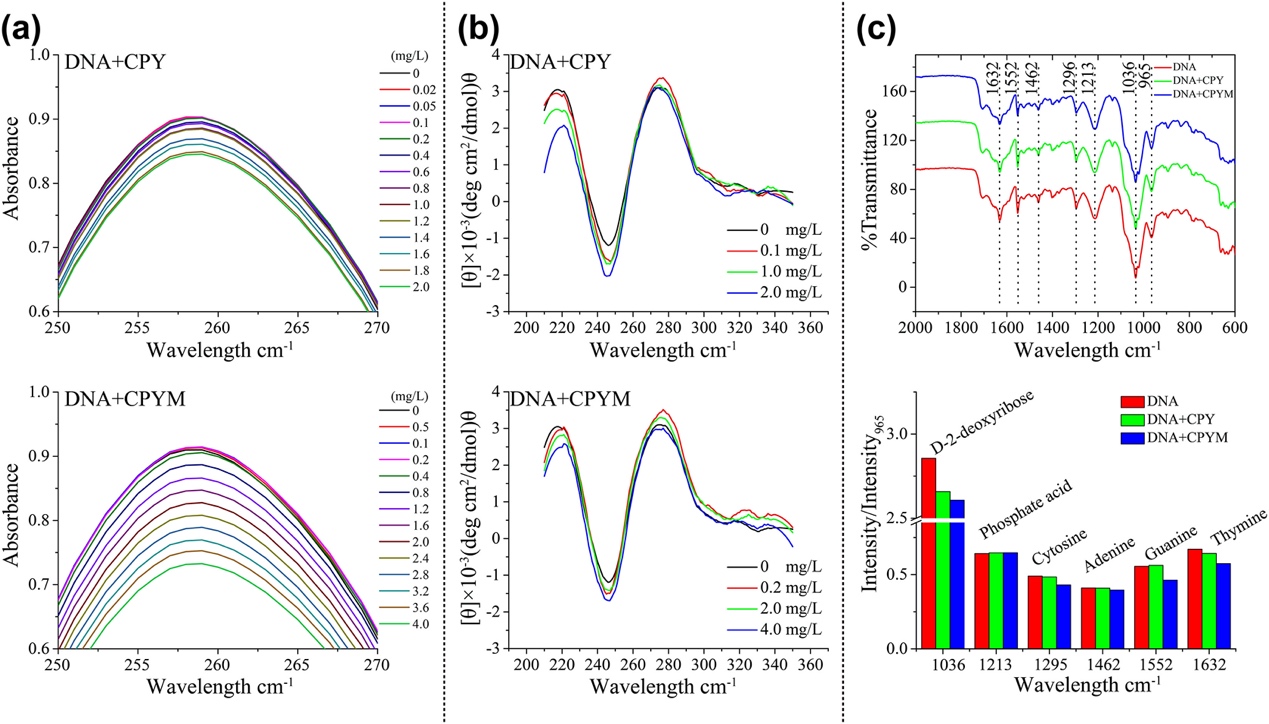
Fig. 2. Ultraviolet, circular dichroism, and Fourier-transform infrared (FTIR) spectral analyses confirming DNA structural changes in the presence of chlorpyrifos and chlorpyrifos-methyl. a, Ultraviolet spectra represent the direction of absorbance change with increasing pesticides concentrations. b, Circular dichroism spectra of DNA base stacking (275 nm) and right–handed helicity (246 nm) with increasing pesticide concentrations. c, FTIR spectra of DNA in the absence and presence of chlorpyrifos (CPY) and chlorpyrifos-methyl (CPYM). The bar graph of (c) shows the intensity ratio variations (Ri) for DNA in–plane vibrations at 1632 (thymine), 1552 (guanine), 1462 (adenine), 1295 (cytosine), 1213 (phosphate acid), and 1036 cm−1 (D–2–deoxyribose) in the absence and presence of CPY and CPYM.
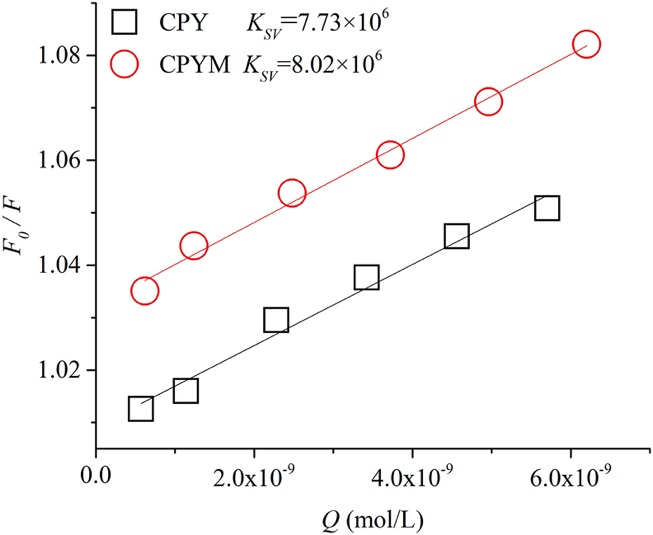
Fig. 3. Stern–Volmer plots for fluorescence quenching of ethidium bromide (EtBr) –labeled DNA by chlorpyrifos (CPY) and chlorpyrifos-methyl (CPYM). The changes in fluorescence intensity of EtBr in DNA was recorded during the CPY and CPYM titration.
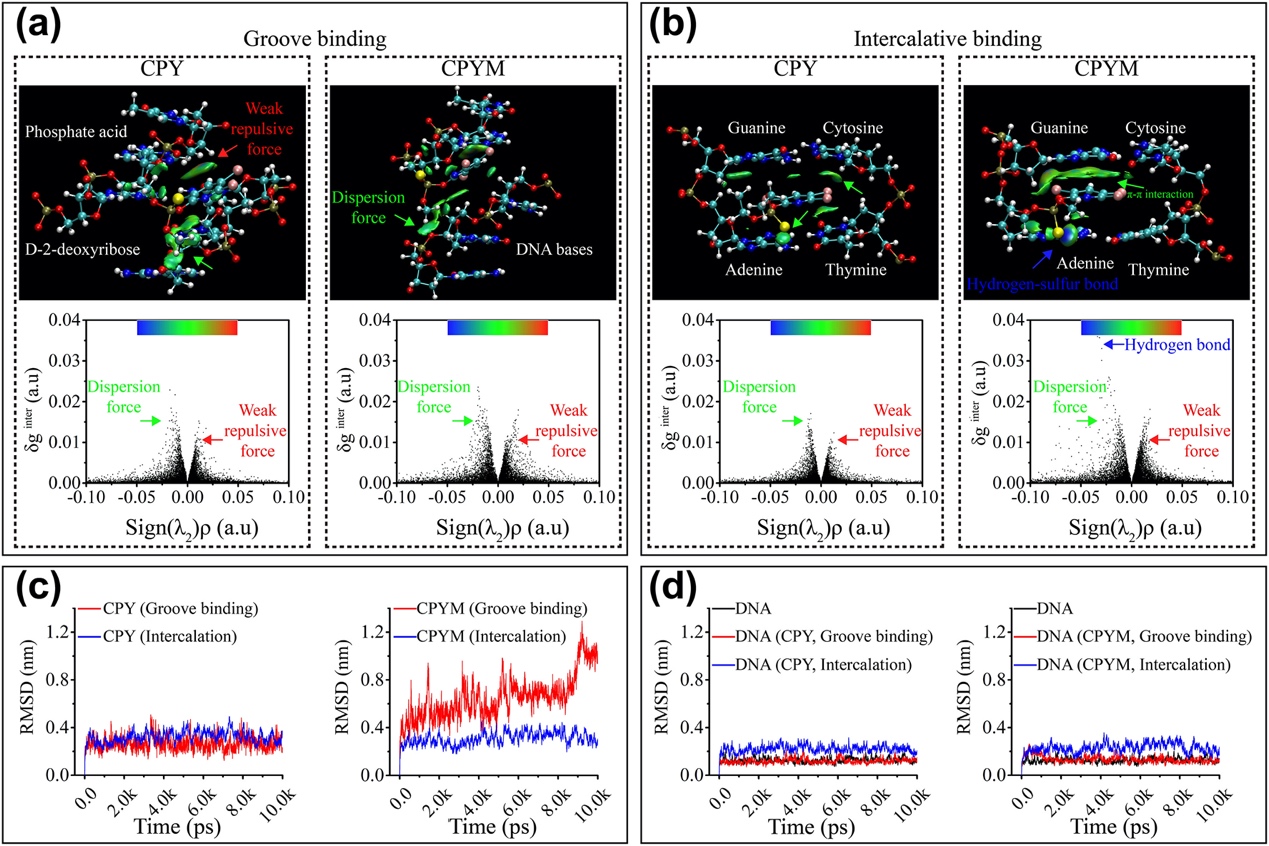
Fig. 4. Computational analysis of DNA–chlorpyrifos (CPY) and DNA–chlorpyrifos-methyl (CPYM) interactions via grooving binding and intercalation. a, b, Models illustrating the gradient iso-surface of the main sections for CPY (a) and CPYM (b) interactions with DNA bases and plots of the reduced density gradient (δginter) vs. the product of electron density (ρ) and the sign of the second Hessian eigenvalue (λ2), with surfaces colored on a blue–green–red scale according to the values and sign of (λ2)ρ from −0.05 to +0.05 au. The blue, green, and red colors indicate attractive interactions, very weak interactions, and strong repulsive non–bonded overlap, respectively. N, H, C, O, P, S, and Cl atoms are represented in blue, white, cyan, red, copper, yellow, and pink, respectively. (c), RMSD vs. time based on molecular dynamics simulation of the binding stability between DNA and pesticides. (d), RMSD vs. time based on molecular dynamics simulation of conformational changes to DNA. (For interpretation of the references to color in this figure legend, the reader is referred to the web version of this article.)
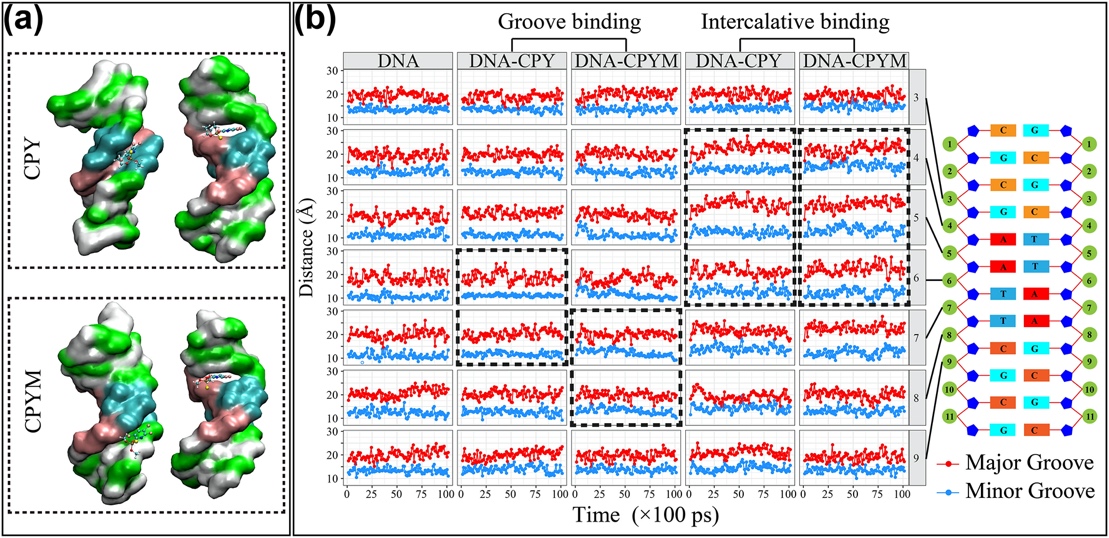
Fig. 5. Molecular dynamics simulation of real-time changes in DNA groove distance and final structures. a, Final structures from the molecular dynamics simulation of DNA–chlorpyrifos (CPY) and DNA–chlorpyrifos-methyl (CPYM) based on the groove–binding and intercalative–binding modes. b, Distance of the major and minor grooves at positions 3–9 in the DNA structure during the simulation time (10 ns). Black dotted frames indicate the distances of the DNA minor and major grooves around the binding site of the pesticide.
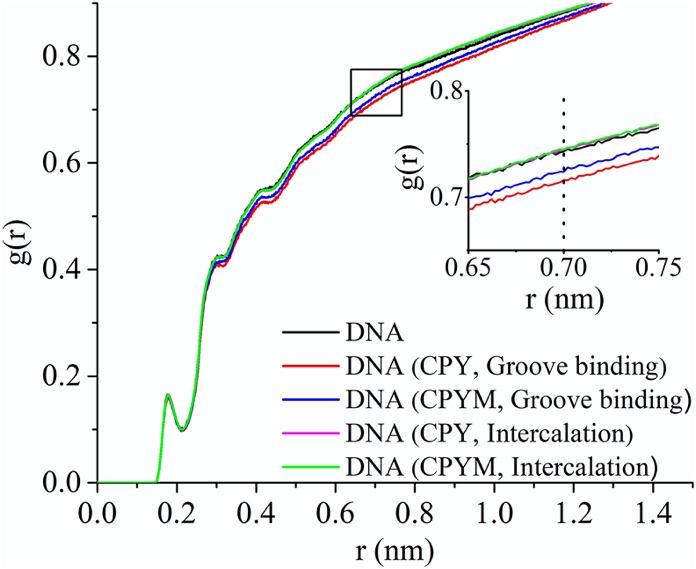
Fig. 6. Water molecular presence probability g(r) vs. DNA distance (r) from the radial distribution function of the water density distribution surrounding DNA molecules. The insert is an enlargement of the section outlined with the black box around the DNA distance of 0.7 nm.
Conclusion : Collectively, this set of experiments advances understanding of some factors and processes that promote eDNA degradation when organophosphorus pesticides were released into the environment and coexisted with eDNA. The enhanced hydrophobicity of the DNA groove upon binding with CPY and CPYM promotes the recognition and binding of DNA by DNase I. Meanwhile, both CPY and CPYM can expand the distance of the DNA groove through intercalation. The expansion further contributes to binding of the DNase I functional domain to the minor groove and facilitating the DNA strand-cutting action of DNase I, thus, ultimately enhancing eDNA degradation in the presence of CPY or CPYM. Our results suggest that legacy pesticides such as organophosphorus pesticides may regulate residual genes in our environment. This investigation uncovers the beneficial approach of combining experimental observations with molecular computation on interactions of eDNA and contaminants in the understanding of the interface mechanism and risks of both DNA and contaminants. In future studies, the relationship between eDNA and target pollutant in natural aquatic environments needs to be further studied. Also, eDNA is more heterogeneous and could also be bound to other molecules (e.g., protein, polysaccharide), which can alter the accessibility of CPY/CPYM to the DNA. It is, therefore, necessary to place the in vitro results in the context of more complicated aqueous systems.
Yueting Pan