Effects of microplastics on plant growth and arbuscular mycorrhizal fungal communities in a soil spiked with ZnO nanoparticles
Title: Effects of microplastics on plant growth and arbuscular mycorrhizal fungal communities in a soil spiked with ZnO nanoparticles.
Download website:
https://doi.org/10.1016/j.soilbio.2021.108179
Abstract
Emerging contaminants such as microplastics and engineered nanoparticles (NPs) have become an environmental issue of global concern, but little is known about their joint effects in soil–plant systems. We studied the effects of two microplastics, conventional non-degradable high–density polyethylene (HDPE) and biodegradable polylactic acid (PLA), on maize growth and arbuscular mycorrhizal (AM) fungal communities in a soil spiked with or without ZnO NPs. HDPE and low–dose PLA promoted plant growth, while high–dose PLA significantly decreased maize shoot (by 16%–40%) and root biomass (by 28%–50%), indicating high-dose PLA may have strong phytotoxicity. ZnO NPs displayed non-significant effects on plant growth, but caused greater Zn accumulation in plants. Both HDPE and PLA further increased Zn concentrations in roots, while decreasing Zn translocation to aerial parts. High–throughput sequencing showed that microplastics and ZnO NPs singly and jointly influenced AM fungal community composition and diversity, particularly the relative abundance of dominant genera. The presence of ZnO NPs and microplastics generally increased soil pH. Overall, our findings imply increasing contamination by microplastics and NPs can have profound ecological impacts on plant fitness, plant quality, and soil microbial community composition and diversity, resulting in uncertain consequences for agroecosystems.
Results
3.1 Plant biomass
Overall, irrespective of ZnO NPs, HDPE increased shoot and root biomass, particularly at the 10% dose (Fig. 1). However, PLA increased plant biomass at the lower doses (0.1% and 1%), but decreased shoot (by 16%–40%) and root biomass (by 28%–50%) at the 10% dose. In most cases, application of ZnO NPs did not affect shoot and root biomass, but did reduce shoot biomass in the treatments that received 50 mg/kg ZnO NPs +0.1% PLA (Fig. 1). A significant interaction was found between HDPE and ZnO NPs on root biomass.
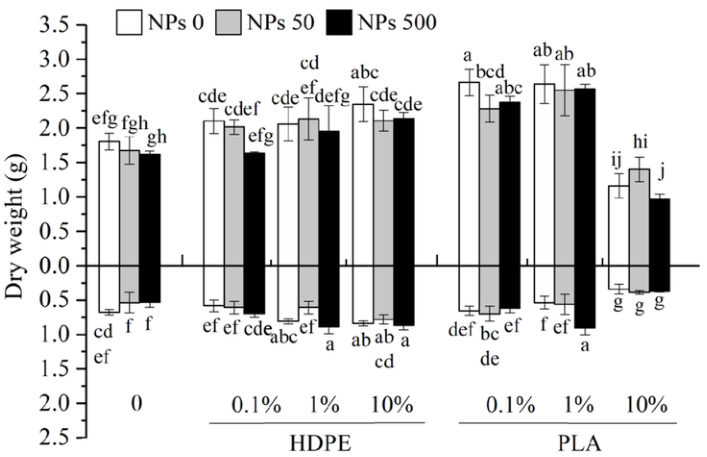
Fig. 1 Shoot (above X-axis) and root (below X-axis) dry weights (means ± SD, n = 4) of maize seedlings exposed to HDPE and PLA with or without ZnO NPs. Note: 0, 50 and 500 represent the concentrations of ZnO NPs, while 0, 0.1%, 1% and 10% represent the addition doses of microplastics. Different letters above or below the bars indicate significant differences among all the treatments using a one-way ANOVA followed by Duncan’s multiple range test (P < 0.05).
3.2 Zn concentration and translocation in plants
Both shoot and root Zn concentrations were greatly increased in soil spiked with ZnO NPs, but were affected by microplastics differently (Fig. 2). In most cases, the microplastics HDPE and PLA increased root Zn concentrations in plants exposed to ZnO NPs, did not change shoot Zn concentrations at 500 mg/kg ZnO NPs, and decreased shoot Zn concentrations at 50 mg/kg. Microplastics also changed Zn concentrations in plants receiving no ZnO NPs (Fig. 2): at the 10% dose, HDPE and PLA both decreased shoot Zn concentrations, but decreased and increased root Zn concentrations, respectively (Fig. 2). Moreover, both HDPE and PLA decreased shoot/root ratios of Zn concentration in plants exposed to ZnO NPs.
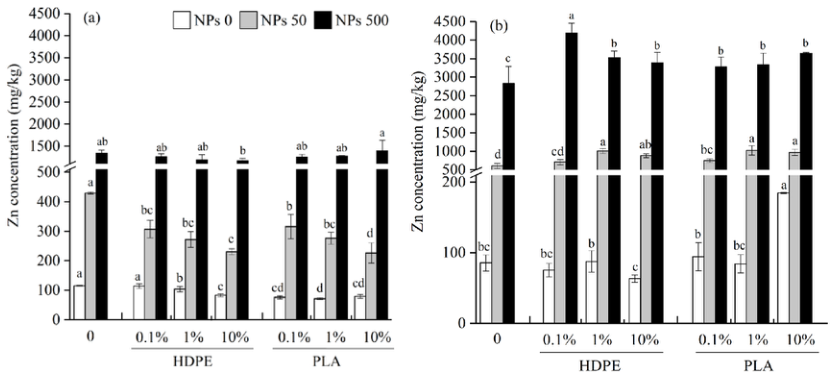
Fig. 2 Zn concentrations (means ± SD, n = 4) in shoots (a) and roots (b) of maize seedlings exposed to HDPE and PLA with or without ZnO NPs. Note: 0, 50 and 500 represent the concentrations of ZnO NPs, while 0, 0.1%, 1% and 10% represent the addition doses of microplastics. Different letters above the bars indicate significant differences among the means in the same ZnO NPs treatment using a one-way ANOVA followed by Duncan’s multiple range test (P < 0.05).
3.3 Soil pH
Soil pH generally increased with increasing ZnO NPs concentration (Fig. 3). The soil exposed to 500 mg/kg ZnO NPs had the highest pH values, irrespective of microplastics. In most cases, both HDPE and PLA increased soil pH, particularly in the presence of ZnO NPs (Fig. 3). ANOVA results confirm that there are interactive effects between HDPE and ZnO NPs
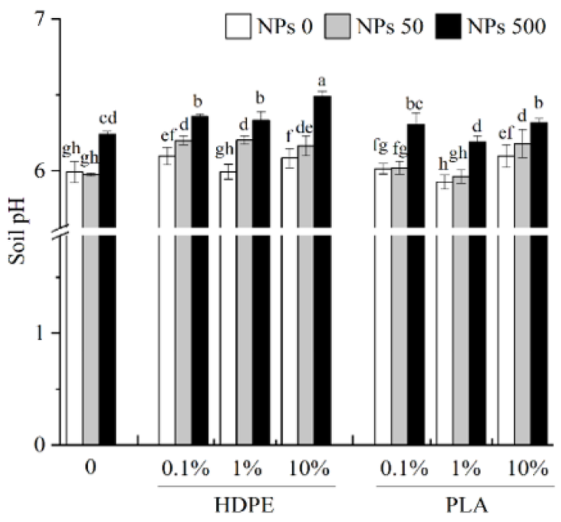
Fig. 3 pH value (means ± SD, n = 4) of soil exposed to HDPE and PLA with or without ZnO NPs. Note: 0, 50 and 500 represent the concentrations of ZnO NPs, while 0, 0.1%, 1% and 10% represent the addition doses of microplastics. Different letters above the bars indicate significant differences among the means in the same ZnO NPs treatment using a one-way ANOVA followed by Duncan’s multiple range test (P < 0.05).
3.4 AMF community structure and diversity
Across all the studied samples, a total of 33,144 OTUs belonging to AMF were identified. Among them, 183 OTUs occurred in all the samples, but specific OTUs varied by treatment (Fig. 4). In total, seven genera were identified, including Paraglomus, Archaeospora, Glomus,Ambispora, Claroideoglomus, Diversispora, and Acaulospora (Fig. 5). Some unknown AMF were also observed.
The community composition and relative abundance of AMF taxa greatly varied with microplastics and ZnO NPs (Fig. 5). Microplastic dose and type significantly influenced some AMF taxa, while ZnO NPs exhibited little impact (three-way ANOVA). Two-way ANOVA results further indicated HDPE significantly influenced the unclassified AMF, while PLA significantly influenced Paraglomus and Glomus. Interactive effects were observed between PLA and ZnO NPs on two genera (Archaeospora and Diversispora). Generally, in most treatments the unclassified AMF had the highest relative abundance, followed sequentially by Paraglomus, Archaespora, and Glomus (Fig. 5). On average, the treatments receiving 10% HDPE and 10% PLA had a higher proportion of unclassified AMF but fewer Paraglomus than the treatments with lower microplastic doses. When PLA dose increased from 0.1% to 10%, the relative abundance of Glomus gradually decreased (Fig. 5).
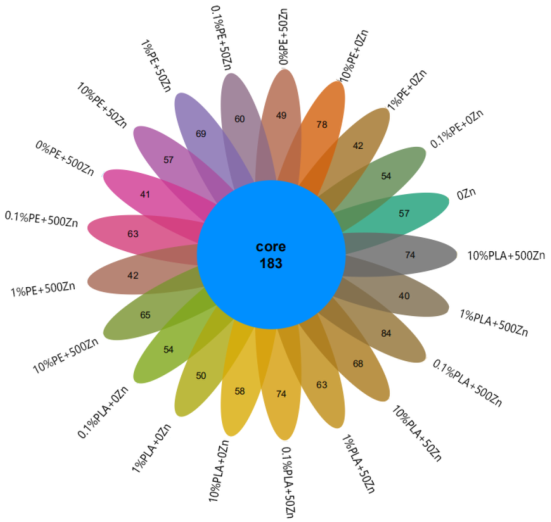
Fig. 4 Number of OTUs in soil exposed to HDPE and PLA with or without ZnO NPs. Note: 0, 0.1%, 1% and 10% represent the addition doses of microplastics; 0Zn, 50Zn and 500Zn represent the treatments with 0, 50, and 500 mg/kg ZnO NPs, respectively.
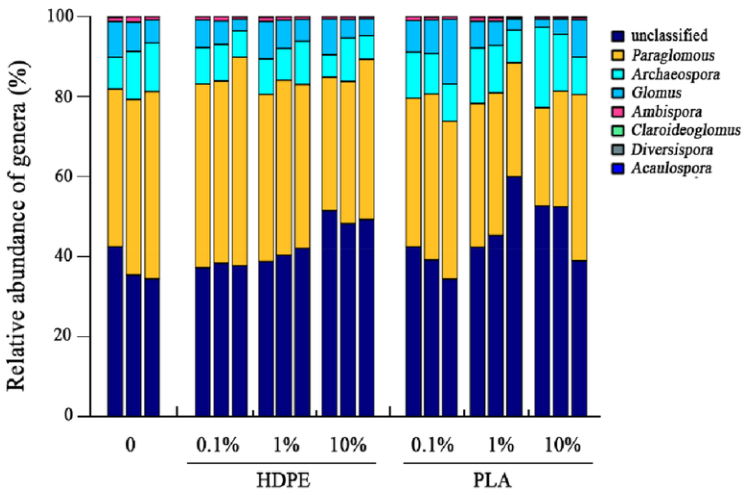
Fig. 5 Relative abundance of AMF at the genus level in soils exposed to HDPE and PLA with or without ZnO NPs. Note: 0, 0.1%, 1% and 10% represent the addition doses of microplastics; the three columns within each microplastic dose group represent the treatments with 0, 50, and 500 mg/kg ZnO NPs, respectively, from the left to right.
Variations in OTU number and alpha diversity of AMF (Chao1, Shannon, Simpson, and ACE indexes) were observed among different treatments. In the treatments with ZnO NPs alone, Chao1, Shannon and ACE indexes all declined with increasing ZnO NPs concentration, with the lowest values at 500 mg/kg. However, cooccurrence with microplastics changed such trends (Fig. 6): PLA had significant impacts on Chao1 index (two-way ANOVA), while HDPE showed no significant overall effect, but still exerted impacts in some treatments. For instance, the treatment with 10% HDPE alone had the highest Shannon index, and the combination treatment of 500 mg/kg ZnO NPs and 10% HDPE had a higher Chao1 index than the treatment with 500 mg/kg ZnO NPs alone. ANOVA results show significant impacts on Shannon and ACE indexes from HDPE–ZnO NPs interaction, and on Simpson index from PLA–ZnO NPs interaction. Significant tripartite interactions among microplastic type, dose and ZnO NPs also occurred on Shannon index. Moreover, Pearson correlation coefficients showed that Shannon index was negatively correlated with ZnO NPs, soil pH, and plant Zn concentrations, but Simpson index was positively correlated.
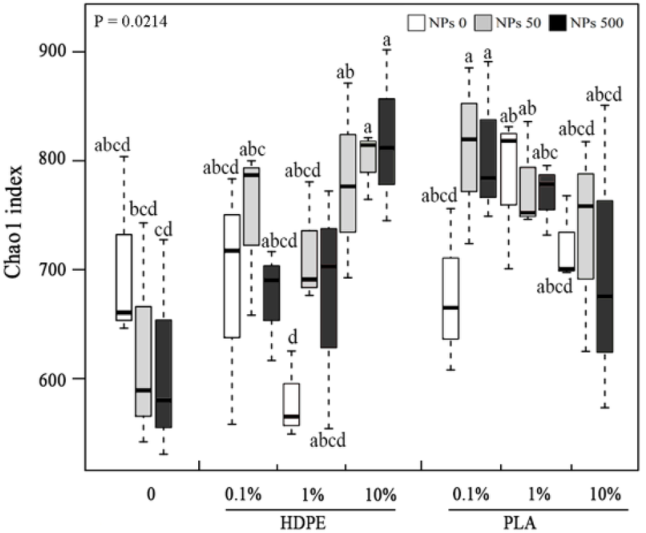
Fig. 6. Chao1 index of AMF (means ± SD, n = 4) in soil exposed to HDPE and PLA with or without ZnO NPs. Note: 0, 50 and 500 represent the concentrations of ZnO NPs, while 0, 0.1%, 1% and 10% represent the addition doses of microplastics. Different letters above or below the bars indicate significant differences among all the treatments using a one-way ANOVA followed by Duncan’s multiple range test (P < 0.05).
Our findings show that the impacts of microplastics on plant growth vary with polymer type and dose: HDPE and low–dose PLA stimulated plant growth while high–dose PLA caused strong phytotoxicity in soil, regardless of the presence of ZnO NPs. Microplastics did not enhance the
negative effects of ZnO NPs on plant growth, but did increase Zn accumulation in roots while decreasing Zn partitioning to shoots. Microplastics and ZnO NPs influenced AMF community structure and diversity, both singly and jointly, and the effects varied with polymer type and dose, as well as ZnO NPs. Our findings imply that increasing contamination by microplastics and NPs has profound ecological impacts on plant fitness and soil microbial community and diversity, and hence produces uncertain consequences for agroecosystems. Our findings forewarn of ecological risks from the accelerating release of microplastics and NPs into soil.
Contact: Liang Jiawen
E-mail: jwliang@smail.nju.edu.cn