Degradation of plant DNA and eDNA in soil
Article 1:
Title:Dynamics of extracellular DNA decomposition and bacterial community composition in soil
Download website:
https://www.sciencedirect.com/science/article/pii/S0038071715001212
Abstract :Microbial necromass is an important source of stabilized organic matter in soil, yet the decomposition dynamics of necromass constituents have not been adequately characterized. This includes DNA, a nutrient-rich molecule that when released into the environment as extracellular DNA (eDNA) can be readily used by soil microorganisms. However, the ecological relevance of eDNA as a nutrient source for soil microorganisms is relatively unknown. To address these deficits, we performed a laboratory experiment wherein soils were amended with 13C-labeled eDNA and clay minerals known to interact with DNA (kaolinite and montmorillonite). The amount of eDNA-carbon remaining in the soil declined exponentially over time. Kaolinite amendment decreased eDNA decomposition rates and, after 30 days, retained a higher fraction of eDNA-carbon (~70% remaining) than control or montmorillonite soils (~40% remaining), indicating that clay mineral sorption can stabilize eDNA-derived carbon in soil. Sequencing of bacterial 16S rRNA genes showed that during the incubation the relative abundance of the added eDNA's sequence decreased by 98%, 92% and 99% in the control, montmorillonite, and kaolinite amended soils respectively. These results suggest that the fraction of eDNA-carbon that remained in the soil was incorporated into microbial biomass, firmly bound to soil constituents, or fragmented and no longer amenable to sequencing. In addition, the eDNA amendment affected the composition of the bacterial community. Specifically, the relative abundance of select phyla (Planctomycetes and TM7) and genera (e.g., Arthrobacter and Nocardioides) were elevated in soils that received eDNA, suggesting these groups may be particularly effective at degrading eDNA and using it for growth. Taken together, these results indicate that while eDNA is consumed by bacteria in soil, a fraction of eDNA material is resistant to decomposition, particularly when stabilized by soil minerals, suggesting a substantial amount of recalcitrant eDNA could accumulate over time.
Main content:
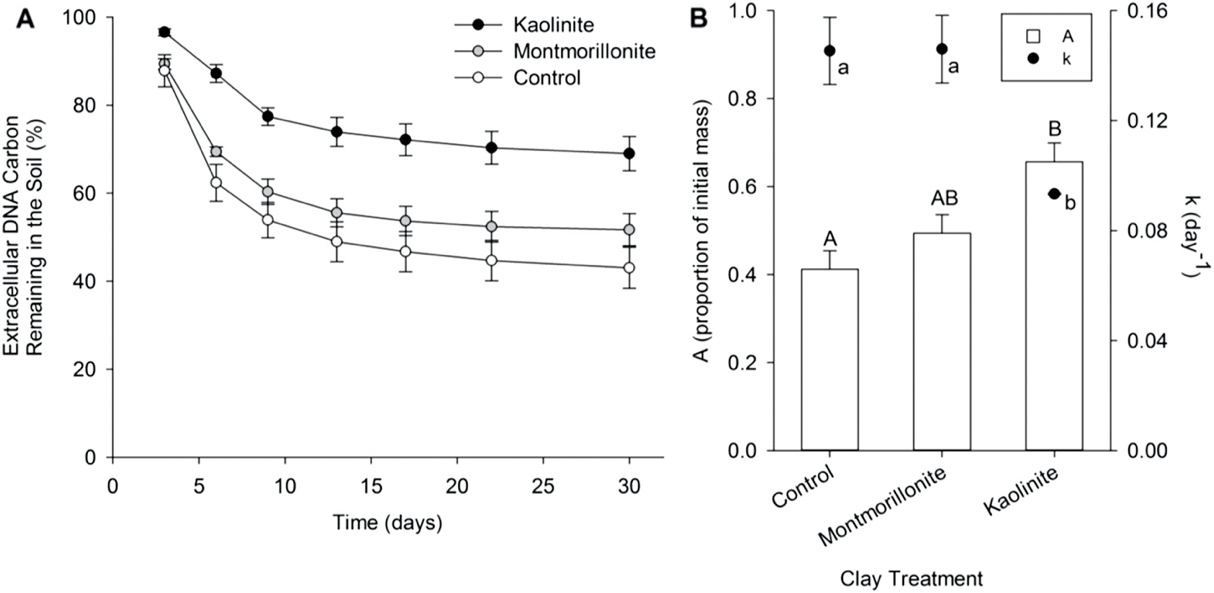
Figure 1. Effect of soil clay on (A) the percentage of initial extracellular DNA (eDNA) carbon remaining in the soil over time, and (B) eDNA decomposition model parameters, where A is the proportion of initial eDNA carbon stabilized in the soil (the asymptote) and k is the decomposition rate constant. Data are mean ± SE and letters designate effects of clay treatment on model parameters A (capital letters) and k (lower case letters) as determined by one-way ANOVA and Tukey's HSD.
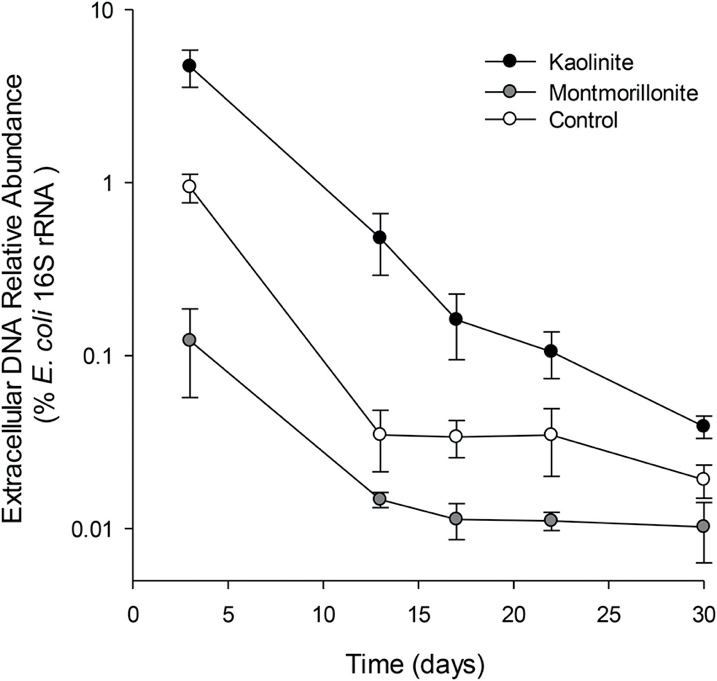
Figure 2. Abundance of added E. coli extracellular DNA as a fraction of the total bacterial community 16S rRNA gene sequences (mean ± SE, log10 scale) in the different soil clay treatments over time.
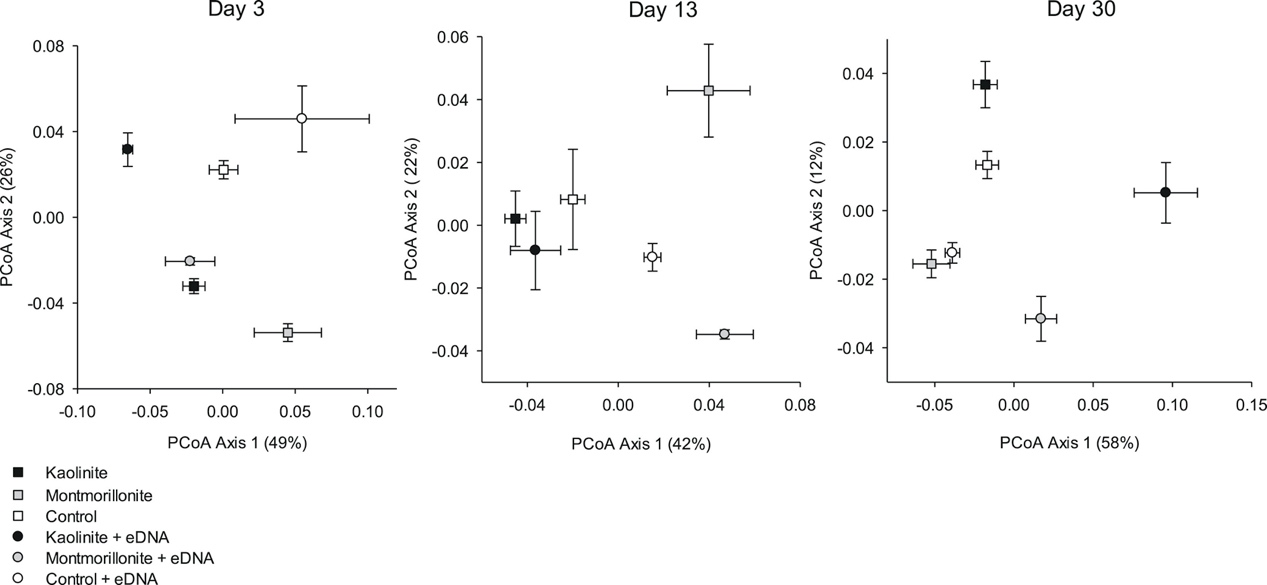
Figure 3. Principal coordinates analysis (PCoA) of bacterial community structure (weighted UniFrac distances) in response to extracellular DNA (eDNA) and clay treatments after 3, 13, and 30 days (centroids are mean ± SE).
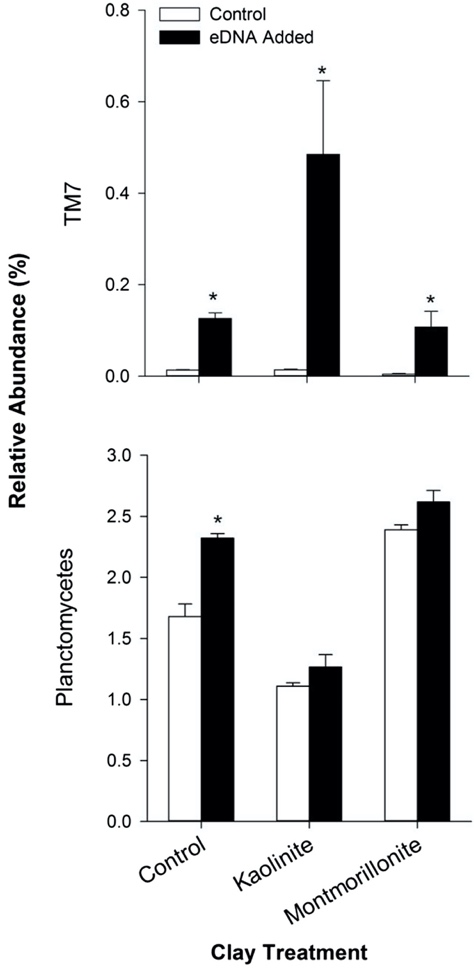
Figure 4. Relative abundances (mean ± SE, % 16S rRNA gene sequences) of phyla that responded positively to extracellular DNA (eDNA) addition on the 13th day of incubation. Significant effects of eDNA as determined by a t-test within each clay treatment (α=0.05) are indicated with a (*).
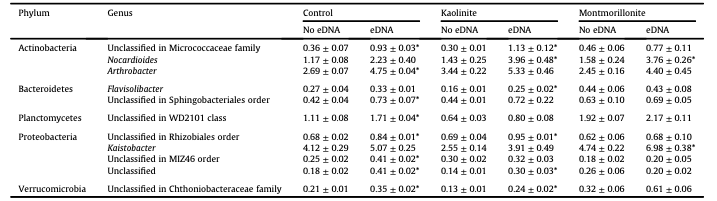
Table 1 Relative abundances (mean ± SE, % 16S rRNA gene sequences) of dominant genera that responded positively to eDNA addition on the 13th day of incubation.
*Indicates significant effect of eDNA as determined by a t-test within each clay treatment (α = 0.01).
Conclusion:
We found that much of the C in eDNA was readily converted to CO2, but a substantial portion remained after 30 days. Our results suggest that sorption of eDNA to soil constituents, especially clay minerals, can stabilize eDNA-C in soil. Consequently, a substantial amount of recalcitrant eDNA-C could accumulate over time. The representation of eDNA in the soil metagenome declined rapidly, suggesting that eDNA stabilized by soil constituents was either tightly bound, or fragmented and no longer amenable to molecular analyses. The mineralization kinetics showed that nucleic acids are readily consumed by microorganisms, indicating eDNA could be an important nutrient source for microorganisms. Concomitant changes in bacterial community composition suggest that some microbial groups (e.g. TM7, Planctomycetes, Arthrobacter, and Nocardioides) may be particularly effective at using eDNA for growth.
Article 2:
Title: Degradation and Transformability of DNA from Transgenic Leaves
Download website : https://aem.asm.org/content/69/1/673
DOI: 10.1128 / AEM.69.1.673-678.2003
Abstract:
The fate of transplastomic (chloroplast genome contains the transgene) tobacco plant DNA in planta was studied when the plant leaves were subjected to decay conditions simulating those encountered naturally, including grinding, incubation with cellulase or enzymes produced by Erwinia chrysanthemi, and attack by the plant pathogen Ralstonia solanacearum. Direct visualization of DNA on agarose gels, gene extraction yield (the number of amplifiable aadA sequences in extracted plant DNA), and the frequency that recipient bacteria can be transformed by plant DNA were used to evaluate the quality and quantity of plant DNA and the transgene. These measurements were used to monitor the physical and biological degradation of DNA inside decaying plant tissues. Our results indicate that while most of the DNA will be degraded inside plant cells, sufficient DNA persists to be released into the soil.
Main content:
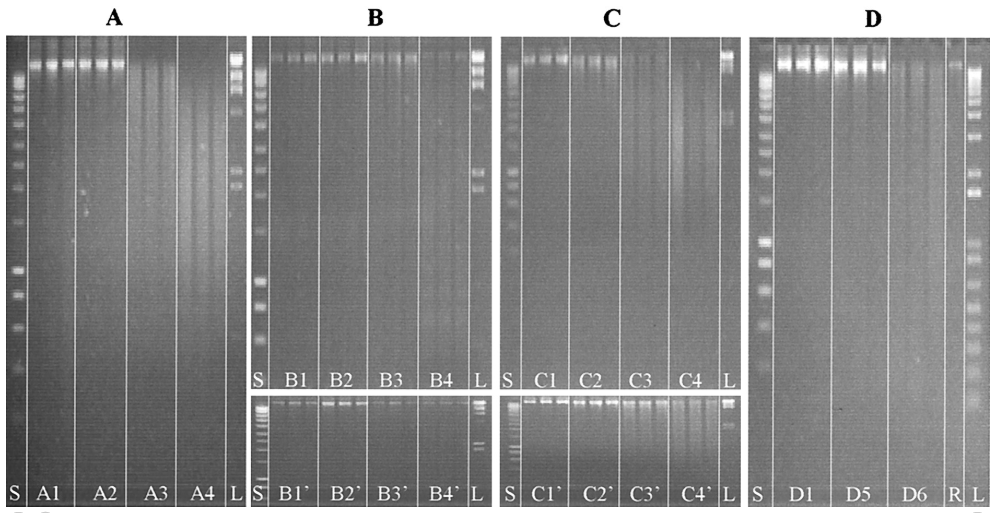
FIG. 1. Kinetics of in planta DNA degradation as estimated by agarose gel electrophoresis of DNA extracted from plant tissues. Three replicates were electrophoresed for each treatment, including incubation times of 0 h (lanes A1, B1, B1’, C1, C1’, and D1), 1 h (lanes A2, B2, B2’, C2, and C2’), 24 h (lanes A3, B3, B3’, C3, and C3’), 72 h (lanes A4, B4, B4’, C4, and C4’), 5 days (lane D5), or 8 days (lane D6). In panel A, plant leaves were ground in liquid nitrogen and left to incubate at room temperature. In panel B, tobacco leaves were incubated with the supernatant of E. chrysanthemi cultures containing pectate lyase and nuclease enzymes, and in panel B’, the leaves were incubated with the sterile M63 culture medium as a control. In panel C, plant leaves were submitted to a commercial cellulase preparation, and in panel C’, they were submitted to the corresponding dilution buffer as a control. Finally, in panel D, plant leaves that had been cut out of the plant were infected in vitro with 108 cells of R. solanacearum strain K60. Lane S, smart ladder; lane L, marker II; and lane R, genomic DNA from R. solanacearum.
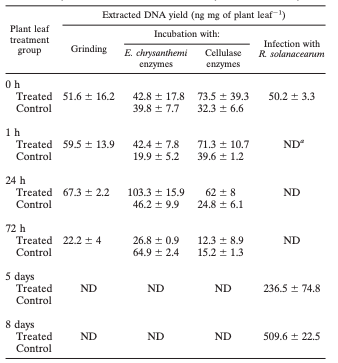
TABLE 1. Kinetics of DNA degradation inside plant leaves subjected to grinding, incubation with enzymatic solutions, and infection by R. solanacearum as estimated by extracted DNA yield
a ND, not determined.
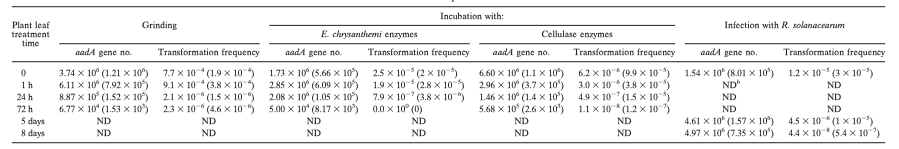
TABLE 2. Kinetics of DNA degradation inside plant leaves subjected to grinding, incubation with enzymatic solutions, and infection by R. solanacearum as estimated by the number of amplifiable aadA gene sequences and transformation frequency of a recipient Acinetobacter sp. bacteriuma
a Standard deviation is indicated in parentheses.
b ND, not determined.
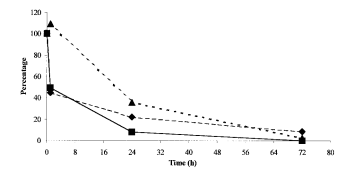
FIG. 2. Percentage change of transformation frequency (■), gene number (♦), and transformation efficiency (as transformation frequency/number of aadA genes) (▴) for the experiment with 800ng of DNA during exposure to the cellulase-containing solution.
Result 1: Plant DNA degradation kinetics in ground plant leaf.
Agarose gel electrophoresis indicates that DNA degradation occurred rapidly, as illustrated by the size distribution, which differed significantly after 24 h from those after 0 and 1 h (Fig. 1A).Both the total DNA and the gene aadA appear to decrease drastically in concentration between 24 and 72 h, indicating that plant nucleases were active. Interestingly, the relative loss of total DNA was about 50% over 72 h, while that of the aadA sequences was >98%, indicating that the shearing process decreased the average size of the DNA fragments, thus preventing amplification of aadA sequences.Transformation frequencies with the lowest quantity of DNA were reduced by 2 orders of magnitude.DNA lost most of its biological potential due to plant nuclease activity(Table 2).
Result 2:Plant DNA degradation kinetics in pectinase-treated plant leaves.
Moreover, incubation of plant leaves for 1 h in either the sterile or E. chrysanthemi culture M63 medium increased the efficiency of the DNeasy plant DNA mini-extraction kit, leading to greater quantities of DNA extracted after incubation (Table 1). The transformation frequency when recovered DNA was used to transform Acinetobacter sp. strain BD413 containing plasmid pBAB2 dropped significantly after 24 h (Table 2), corresponding to a transformation frequency loss of 98%, and then continued to decrease by more than 2 orders of magnitude after 72 h. All of these results are consistent with the concept that plant DNA still present inside plant cells was subjected to degradation.
Result 3: Plant DNA degradation kinetics in cellulase-treated plant leaves.
DNA degradation occurring inside the transgenic tobacco plant cells treated with cellulase was faster than when plants were treated with pectinase-containing E. chrysanthemi extracellular solution. DNA smears were detected after incubation for only 1 h in the cellulase-containing solution (Fig. 1C). Larger DNA fragments present after 1 h were gradually degraded during their incubation. After 72 h, most of the fragments were below 2 kb in size (Fig. 1C). Incubation of leaf pieces in sterile Na-acetate buffer also resulted in DNA degradation within 24 h. However, smear patterns indicated that DNA was much less degraded in these control samples than in those treated with cellulase-containing solution (Fig. 1C and C’).
Result 4: Plant DNA degradation kinetics in R. solanacearum-infected plant leaves.
Tobacco leaves, which were cut out of the plant and infected in vitro with 2.64×10⁸ cells of R.solanacearum strain K60, exhibited wilting symptoms similar to those observed in greenhouse plants infected by R. solanacearum. Extracted DNA exhibited patterns on agarose gel (Fig. 1D) indicating that the DNA maintained a high level of integrity for at least 5 days following bacterial inoculation (Fig. 1D, lanes D5). However, at t =8 days, a smear could be detected, the loss of the higher fragments indicating that degradation occurred (Fig. 1D, lanes D6). Spectrophotometric quantification of DNA indicated that the amounts of DNA material extracted from contaminated plants increased regularly and significantly. These data could be related to a release of bacterial DNA during plant infection. Moreover, the strong decrease (by 2 orders of magnitude) in transformation frequency could be directly related to the presence of R. solanacearum genomic DNA that diluted the aadA sequences in the transforming DNA solution. However, the possibility that leaf colonization by the bacteria leads to changes in plant cell structure that would improve the efficiency of DNA extraction cannot be excluded.
Conclusion:
In conclusion, the kinetics of DNA degradation in plant cells submitted to decay processes could vary, depending on various biotic and abiotic factors. This confirms the interest in studying plant DNA after plant decay, but before the DNA enters the soil. Actually, this “residuesphere,” defined as the interface between decaying plant material and the soil matrix, was shown to be a “ hot spot ” for bacterial growth and conjugal gene transfer. Even if most of the DNA is degraded in planta, enough DNA would persist to contribute to the pool of extracellular and potentially biologically active DNA in soil.
Yueting Pan